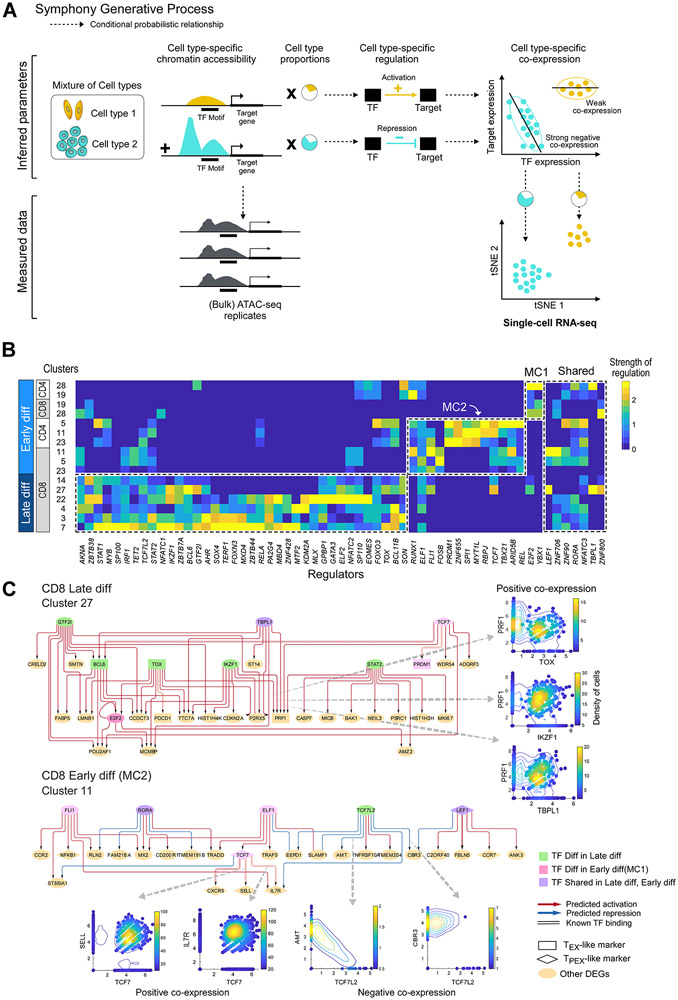
Figure 5. Regulatory circuitry underlying exhausted T cell subsets.
(A) Generative process for Symphony, a probabilistic model that infers regulation from integration of ATAC-seq and scRNA-seq data. Dotted line arrows indicate conditional probabilistic relationship. (B) Heatmap showing scaled values of predicted regulatory strength of TFs (i.e. magnitude of regulation independent of sign) from Symphony (STAR Methods; Figure S4B, M10-12), averaged across differentially expressed genes characterizing each cluster. Master regulators that are differential (t-test p<0.05) or shared between late and early differentiated (“diff”) T cell subsets are shown in dotted lines. (C) Predicted regulatory circuitry for two example clusters; arrows between nodes indicate regulatory impact of a TF on a target gene. Master regulators that are differentially enriched in late differentiated, TEX-like and early differentiated, TPEX-like subsets are shown in green or pink nodes, respectively. Circuitry for other enriched clusters are shown in Figure S5. See also Figures S5 and S7.

