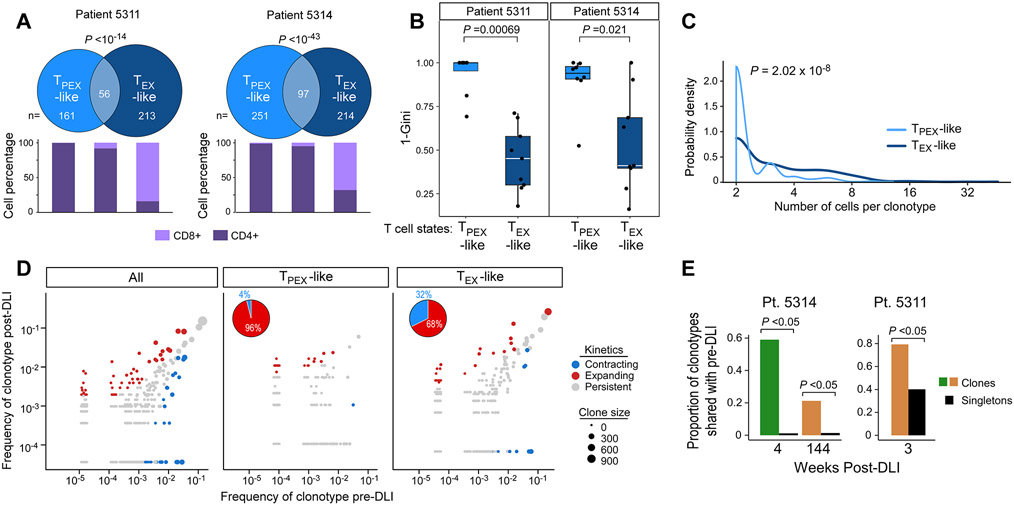
Figure 6. Clonal properties, distributions and evolution during response to DLI.
(A) Venn diagrams showing clonotype overlap between TPEX-like and TEX-like cells from two R patients (5311 and 5314), and stacked bars indicating percentage of CD8+ and CD4+ T cells in TPEX-like, TEX-like and overlap categories. P value calculated from hypergeometric test. (B) TPEX-like clusters show increased TCR diversity (quantified with Gini coefficient) compared to TEX-like clusters, Wilcoxon. Box plot elements display center line as median; box limits as first and third quartiles; whiskers extend to 1.5x interquartile range with points as outliers. TPEX-like clusters: 5311, n=6; 5314, n=8; TEX-like clusters: 5311,5314 n=9. (C) Probability densities of clone sizes for all TEX-like and TPEX-like cells from samples derived from R patients 5314 and 5311. (D) Clonotype frequencies 1 month before and 1 month after DLI from both R patients. Each dot represents a clonotype with dot size proportional to size of clone for each cell subset. Expanding/contracting clonotypes determined with Fisher’s exact test (P<0.05). Left, clonotypes from all cells colored by one of three dynamic patterns: contracting, expanding, persistent. Middle, right dynamic clonotypes from TPEX-like clusters are less likely to be contracting compared to clonotypes from TEX-like clusters (pie charts). (E) Barplots of proportions of clonal versus singleton TCRs shared with pre-DLI samples from each post-DLI timepoint from 5314 (n=2 post-DLI samples) and 5311 (n=1 post-DLI sample).

