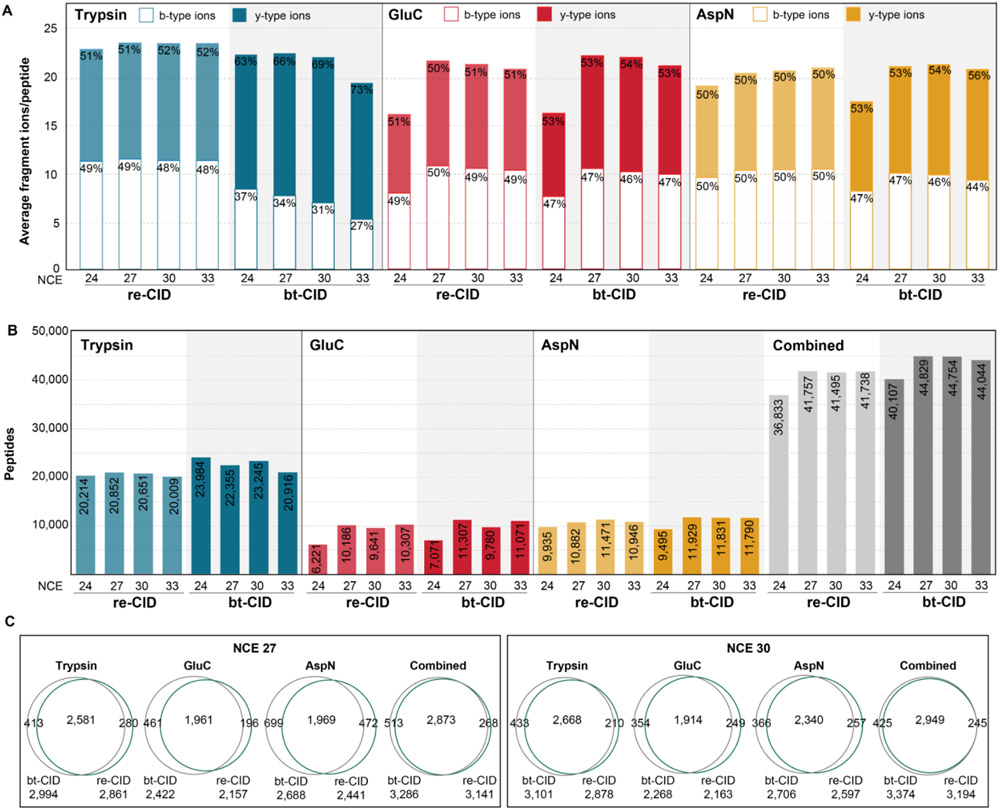
Figure 1. Evaluation of DIA acquisition parameters for individual proteases.
(A) Average number of y-type (filled bars) and b-type (open bars) ions identified per protein in each spectral library. Percentages correspond to the proportion of y- or b-type ions in each spectral library. (B) Peptides identified in DDA experiments (colored bars) for each protease with the specified fragmentation and normalized collision energy (NCE). Combined peptides for all proteases at the specified fragmentation and NCE are plotted in gray. (C) Overlap between re-CID and bt-CID protein group identifications following DDA analysis for each protease at NCEs of 27 and 30.

