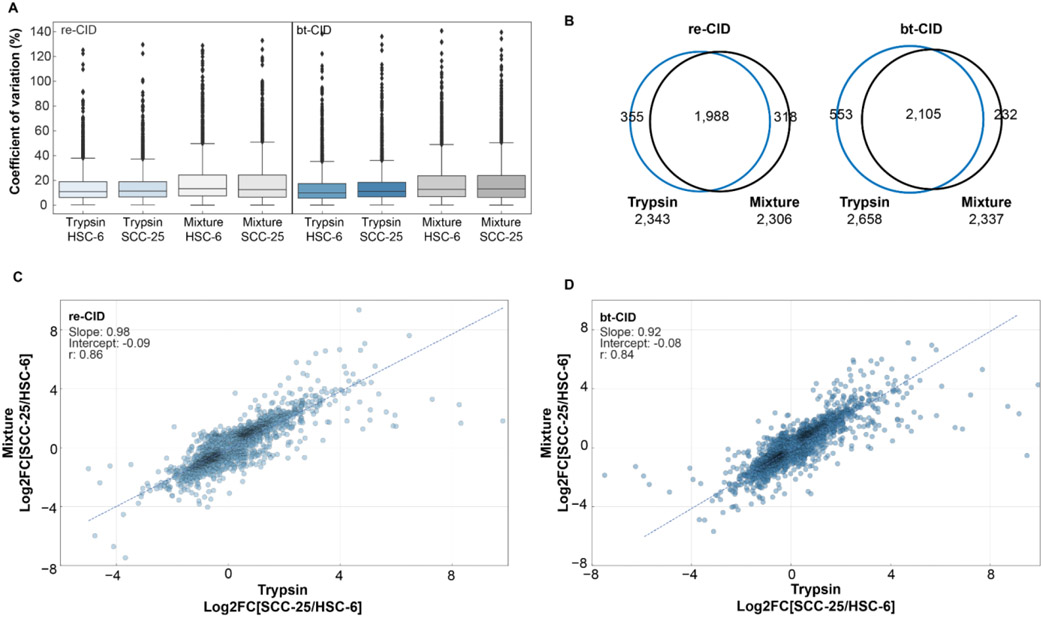
Figure 6. Evaluation of quantitative performance.
(A) CVs for trypsin and mixture analyses of HSC-6 and SCC-25 cell lines using either re-CID or bt-CID. (B) Overlap of significantly changing proteins (corrected P-value <0.05) for trypsin and mixture analyses using either re-CID or bt-CID. (C) Correlation of log2 fold-change values (SCC-25 vs. HSC-6) for common proteins in the trypsin-only (x-axis) and mixture (y-axis) datasets analyzed with re-CID. (D) Correlation of log2 fold-change values (SCC-25 vs. HSC-6) for common proteins in the trypsin-only (x-axis) and mixture (y-axis) datasets analyzed with bt-CID.

