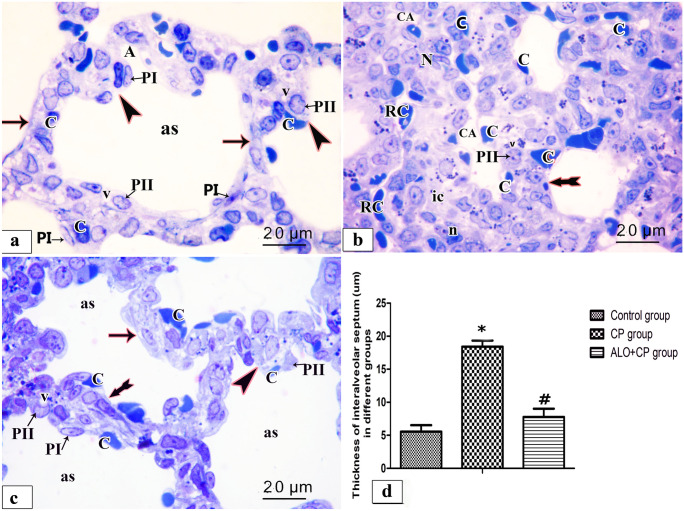
Fig. 7.
Representative microscopic images of semi sections of rat lung from the different experimental groups. a. control, b. CP, c. ALO + CP groups. Arrow, bifid arrow, and arrowhead illustrating primary interalveolar septa, thick primary interalveolar septa, secondary septa, respectively. alveoli sac (as), round nucleus of type II pneumocytes (PII), flat nucleus of type I pneumocyte (PI), vacuolated cytoplasm (v), single blood capillary (C), variable shapes interstitial cells (ic), irregular pale nuclei (N), dark oval nuclei (n). collapsed alveoli (CA), RBCs in the lumen (RC) d. Histogram shows the statistical analysis of the thickness of inter-alveolar septa from the different experimental groups. Data are represented as the means ± standard error of mean (SEM); analyzed by One-way ANOVA followed by Tukey’s multiple comparisons test. A level of probability (P value) ≤ 0.05 was considered significant. * Compared with the Control group, # compared with CP group

