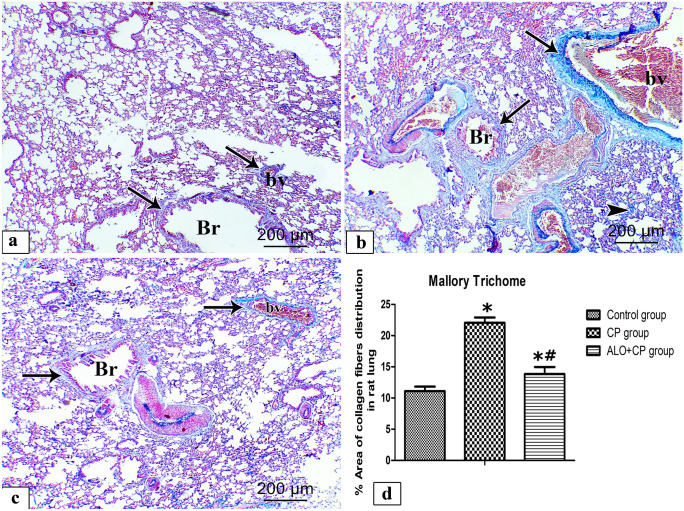
Fig. 8.
Representative microscopic images of Mallory’s trichrome stained rat lung sections from the different experimental groups. a. Control, b. CP and c. ALO + CP groups. Arrow refers to the blue staining of the collagen fibres around the bronchioles (Br), pulmonary blood vessels (bv). Arrowhead refers to the blue staining of collagen fibres within the lung interstitium. d. Histogram shows the statistical analysis of the changes in the % area of collagen fibres distribution from the different experimental groups. Data are represented as the means ± standard error of mean (SEM); analyzed by One-way ANOVA followed by Tukey’s multiple comparisons test. A level of probability (P value) ≤ 0.05 was considered significant. *Compared with the Control group, # compared with CP group

