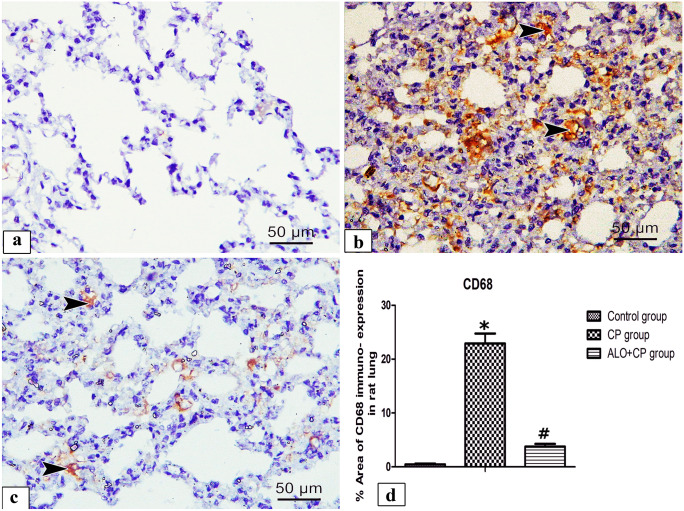
Fig. 9.
Representative microscopic images of immunohistochemically stained lung sections with anti- CD68 antibody of alveolar macrophage from the different experimental groups. a. Control, b. CP and c. ALO + CP groups. Arrowhead refers to positive brown cytoplasmic reacted cells. d. Histogram shows the statistical analysis of the of changes in the % area of CD68 immuno-expression from the different experimental groups. Data are represented as the means ± standard error of mean (SEM); analyzed by One-way ANOVA followed by Tukey’s multiple comparisons test. A level of probability (P value) ≤ 0.05 was considered significant. *Compared with the control group, # compared with CP group

