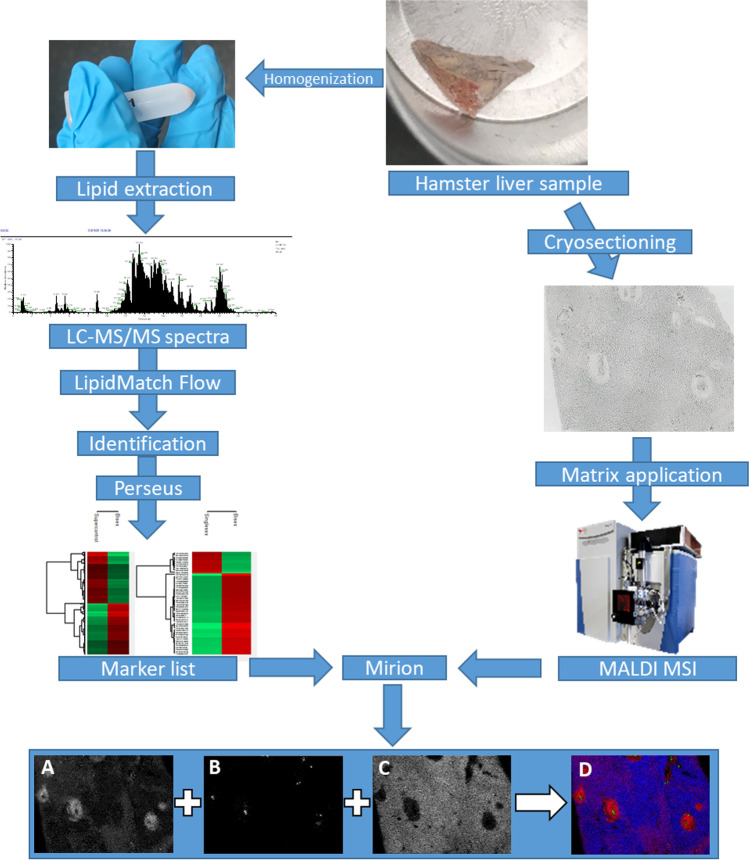
Fig. 2.
Hamster liver samples were either homogenized or cryosectioned. After homogenization, lipids were extracted, and samples were analyzed using LC–MS/MS. With the help of LipidMatch Flow and Perseus, identified signals were annotated and markers were identified that occurred with statistically determined significance. After cryosectioning, matrix was applied, and samples were measured using MALDI MSI. Using the software Mirion and the marker list from LC–MS/MS experiments, MS images were generated: (A) m/z 500.275684, LPE(20:4), [M − H]−; (B) m/z 866.592639, PS(42:4), [M − H]−; (C) m/z 776.526946, MMPE(16:0_22:6), [M − H]−; (D) RGB overlay of MS images A, B, C

