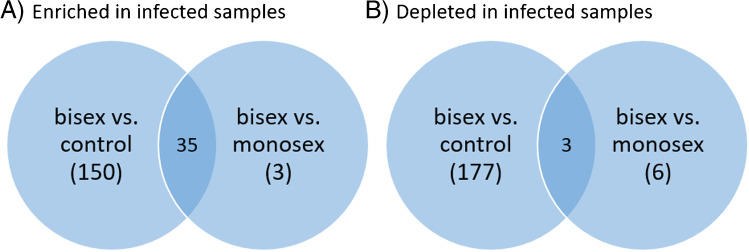
Fig. 3.
Venn diagram showing the numbers of infection markers found. Many more infection markers were found to be enriched when comparing bisex-infected with control samples than with monosex-infected samples (A). The same holds for depleted infection markers (B). The terms “enriched” and “depleted” have to be used carefully since further biological analysis is needed to verify that the eggs actually take up and metabolize the lipids. Here, the terms are meant to describe changes in signal intensities found in LC–MS/MS measurements

