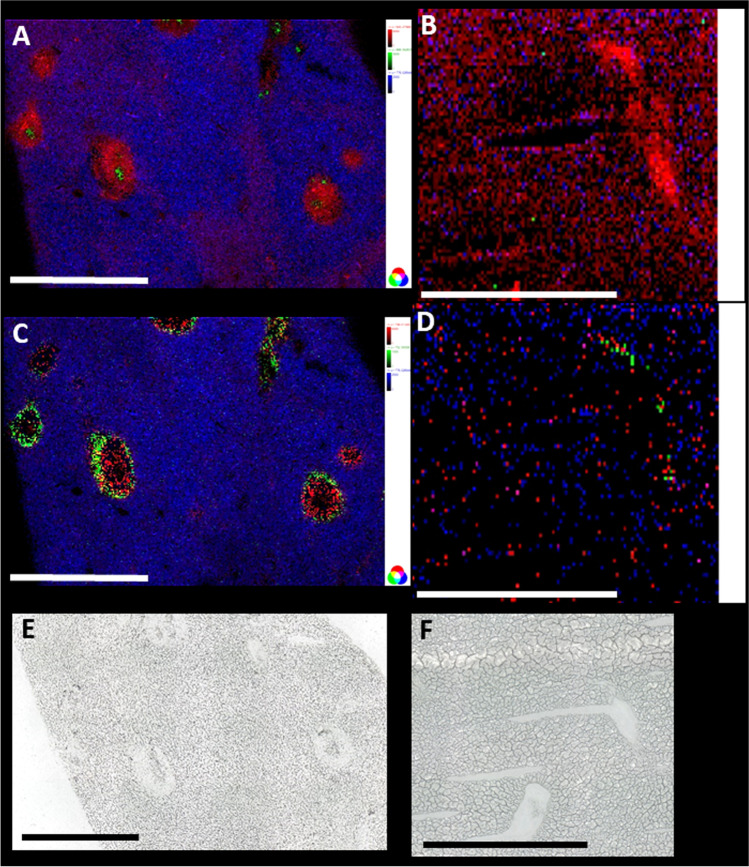
Fig. 5.
Comparison between liver sections of a bisex-infected hamster (A, C) and a healthy control sample (B, D). For A, m/z 500.275684, LPE(20:4), [M − H]− (red) was found to be a marker for granuloma; m/z 776.526946, MMPE(16:0_22:6), [M − H]− (blue) a marker for surrounding tissue; and m/z 866.592639, PS(42:4), [M − H]− (green) a marker for schistosome eggs. For the non-infected sample, B shows the same ions in the same colors, but no characteristic distribution was found. This underlines that statistical markers found by LC–MS/MS also show recognizable and allocatable distributions in the imaging measurements. In image C, m/z 746.511353, plasmenyl-PE(P-16:0/22:6), [M − H]− (red) as a marker for granuloma and m/z 752.555581, plasmanyl-PE(O-18:0/20:4), [M − H]− (green) as a marker for granuloma borders were selected for creating the RGB image. Again, m/z 776.526946 was taken as a marker for non-affected tissue (blue). The same coding as in C was chosen for image D of a non-infected (control) sample, and again, we found no characteristic distribution. Scale bars are 1 mm. Single-ion images are shown in Figure S7 and Figure S8. E and F are the corresponding optical images of the samples

