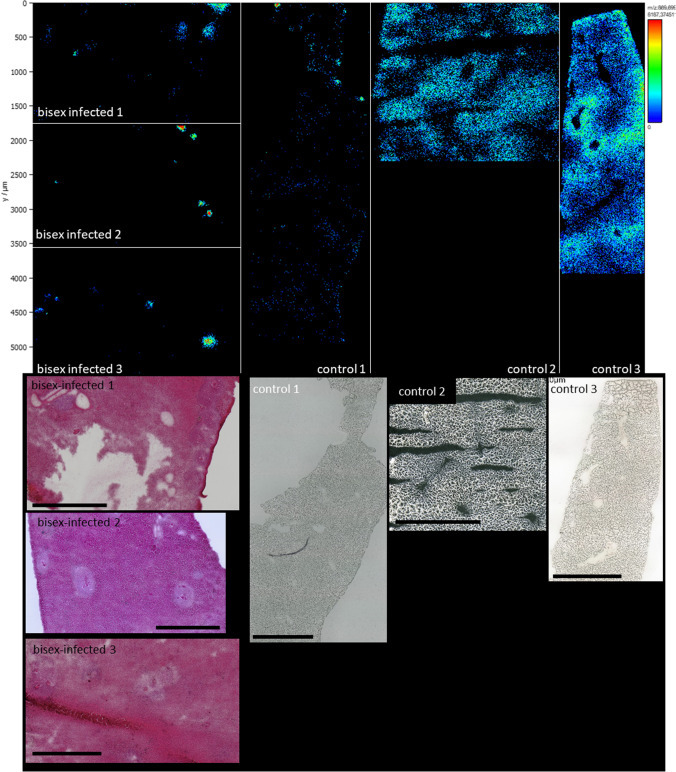
Fig. 6.
Upper part: Distribution comparison of m/z 869.698690 TG(16:0_16:1_18:1) [M + K]+. Liver samples of bisex-infected hamsters are shown on the left side; control samples are grouped on the right side. While the lipid is evenly distributed in the control samples, accumulation in the eggs and the surrounding granuloma area of the bisex sample group is clearly visible. Overall, this triglyceride was found enriched in control samples by LC–MS/MS. Lower part: Corresponding optical images of the samples. Scale bars are 1 mm

