
FIG. 5.
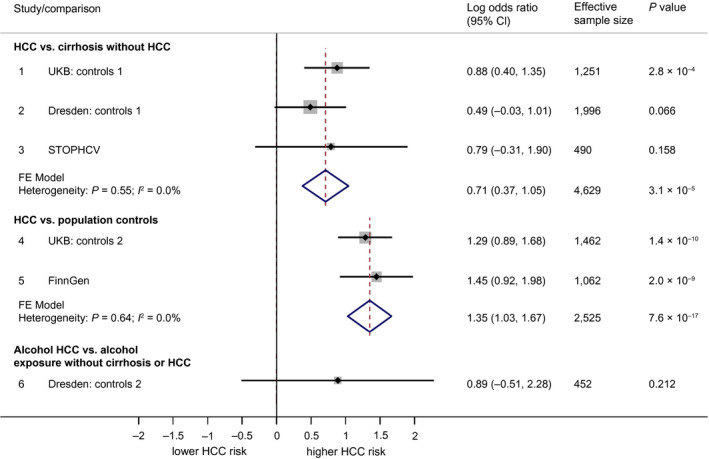
Forest plot showing association between rs187429064:G (TM6SF2) and HCC. Associations are broken down into the following three categories: 1) comparing HCC to cirrhosis controls without HCC, 2) comparing HCC to population controls (who for the most part will not have liver disease), and 3) comparing alcohol HCC to individuals with an alcohol exposure but without cirrhosis or HCC. Associations are presented in terms of the LOR. An LOR of 0 indicates that the frequency of rs187429064:G is the same for cases as for controls. LORs were calculated using logistic regression under an additive genetic model. Pooled effects are based on fixed‐effect meta‐analysis, weighted by effective sample size.