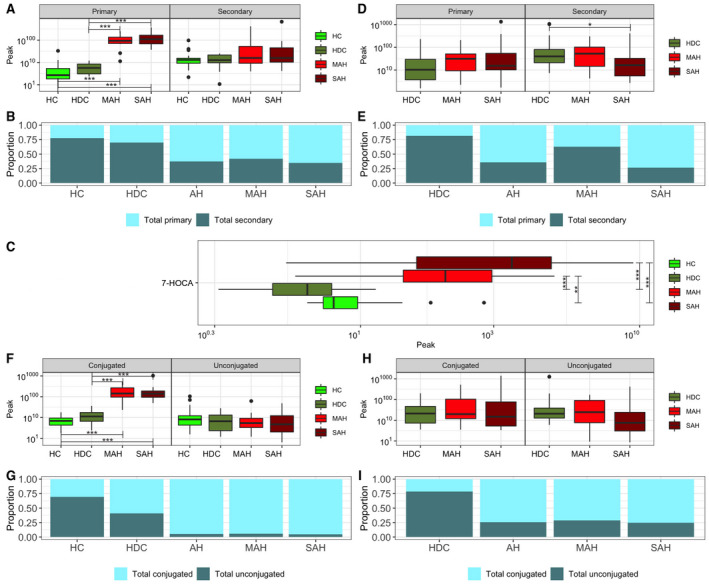
FIG. 1.

Plasma and stool bile acid profile comparison in each disease group. (A) Boxplots of total primary and secondary plasma bile acids; the y‐axis labels are displayed on the original scale even though the data are log10 transformed. (B) Proportion of total primary and secondary plasma bile acids. (C) Boxplot of 7‐HOCA in plasma; the x‐axis labels are displayed on the original scale even though the data are log10 transformed. (D) Boxplots of total primary and secondary stool bile acids; the y‐axis labels are displayed on the original scale even though the data are log10 transformed. (E ) Proportion of total primary and secondary stool bile acids. (F) Boxplots of total conjugated and unconjugated plasma bile acids; the y‐axis labels are displayed on the original scale even though the data are log10 transformed. (G) Proportion of total conjugated and unconjugated plasma bile acids. (H) Boxplots of total conjugated and unconjugated stool bile acids; the y‐axis labels are displayed on the original scale even though the data are log10 transformed. (I) Proportion of total conjugated and unconjugated stool bile acids. Horizontal segment endpoints in each plot represent the significant results for comparison between groups used in the two sample t test (e.g., between HDC and SAH); *P ≤ 0.1; **P ≤ 0.05; ***P ≤ 0.001.
