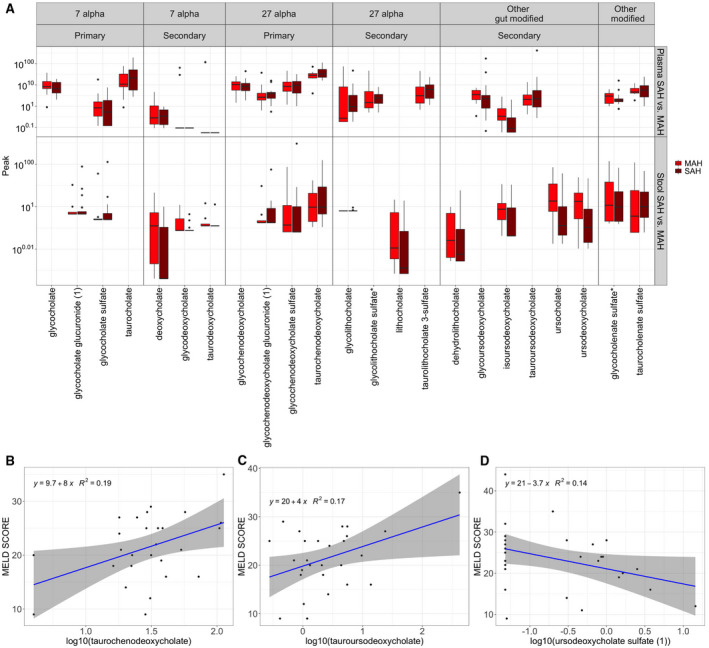
FIG. 3.

Alternations in bile acids due to severity of AH. (A) Boxplots of the plasma and stool bile acids that have significant differences across all three pairwise comparisons (HDC vs. HC, AH vs. HDC, and SAH vs. MAH); the y‐axis labels are displayed on the original scale even though the data are log10 transformed. (B) Association between MELD score and taurodeoxycholate in plasma. (C) Association between MELD score and tauroursodeoxycholate in plasma. (D) Association between MELD score and ursoodeoxycholate in stool.
