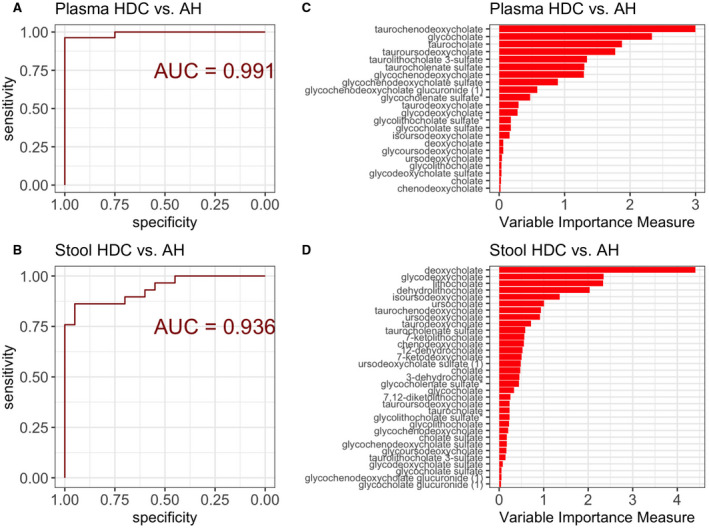
FIG. 4.

Plasma and stool metabolites predictive model of alcoholic hepatitis. (A) ROC curve for the predictive model of AH using plasma metabolites. Larger AUROC curve value corresponds to stronger predictive ability of the model to discriminate patients with HDC from AH. (B) ROC curve for the predictive model of AH using stool metabolites. Larger AUROC value corresponds to stronger predictive ability of the model to discriminate patients with HDC from AH. (C) Plasma metabolites variable importance plot in the classification model of HDC versus AH; longer bars correspond to higher importance of that metabolite. (D) Stool metabolites variable importance plot in the classification model of HDC versus AH; longer bars correspond to higher importance of that metabolite. Abbreviation: AUROC, area under the receiver operating characteristic curve.
