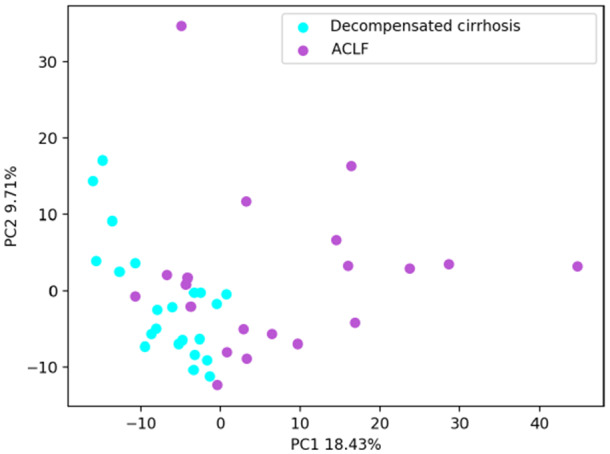
FIG. 1.

PCA of all patients included in the descriptive cohort and the 837 metabolites analyzed. Each circle corresponds to 1 patient. Light blue circles indicate decompensated cirrhosis without ACLF; purple circles indicate ACLF. PC1 explains 18.43% of the total variation. PC2 explains 9.71% of the total variation. Abbreviations: PC1, principal component 1; PC2, principal component 2.
