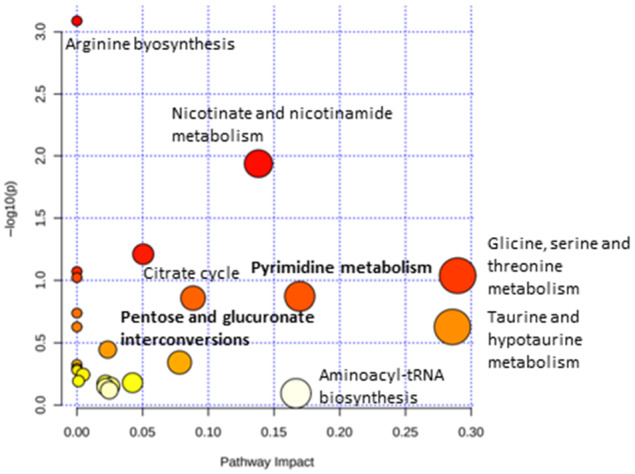
FIG. 5.

Pathway enrichment analysis, including the metabolites differentially expressed in ACLF in patients treated with simvastatin plus rifaximin compared to those in patients treated with placebo in the intervention cohort. The y axis represents the P value; the x axis represents pathway impact (pathways more likely to be modified in ACLF compared with decompensated cirrhosis without ACLF). Node color is based on the P value (red indicates higher level of significance), and node radius is based on the pathway impact value. A significant enrichment for several metabolic pathways was identified for these metabolites (P < 0.05).
