
FIGURE 4.
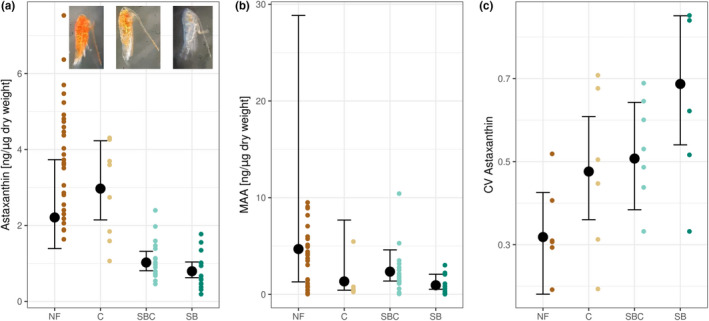
Effects of fish on (a) astaxanthin, (b) MAA, and (c) CV of astaxanthin. The colored dots represent the observed data points. The black dots represent posterior medians, and the error bars show 95% credible intervals for conditional effects at their mean lake depth. For abbreviations see Figure 1