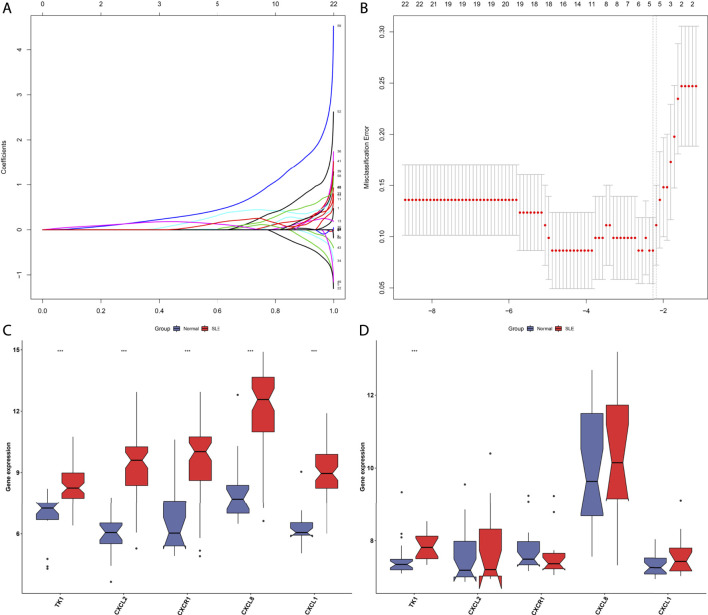
FIGURE 4.
Establishment of a LASSO model for distinguishing SLE from normal controls. (A) Ten-fold cross-verification of turning parameter selection in the LASSO model. (B) LASSO coefficient profiling of the hub genes. (C) Box plots show the expression of characteristic genes in SLE and normal PBMCs in the GSE50772 dataset. (D) Verification of the expression of characteristic genes in SLE and normal PBMCs in the GSE81622 dataset. ***p < 0.001.

