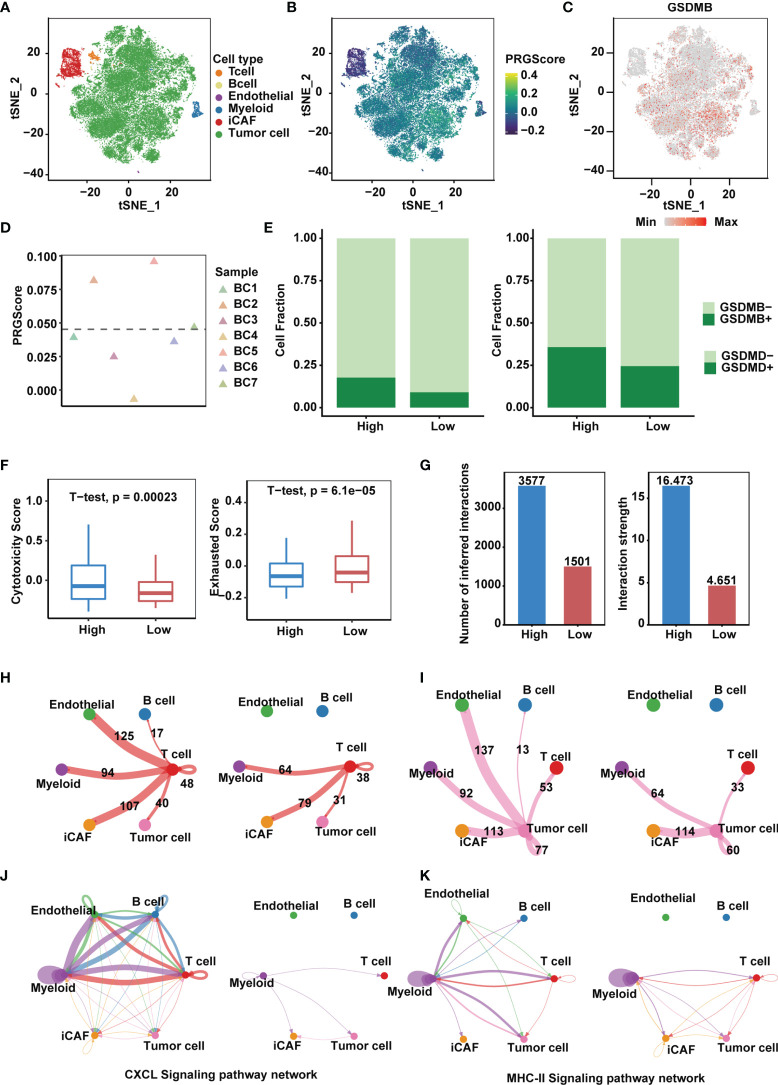
Figure 6.
High PRGScore implies an immune-active tumor microenvironment in the single cell cohort. (A) t-SNE plot showing the composition of 6 main subtypes derived from bladder cancer samples. (B) The dynamics of PRGScore in 6 main cell types are represented in the t-SNE plot. (C) t-SNE plot showing the expression level of GSDMB for all the cell types. (D) Distribution in the PRGScore of seven bladder cancer samples (divided into 2 patterns). (E) The proportion of GSDMB + tumor cells (left) and GSDMD + tumor cells (right) in the high or low PRGScore group. (F) Differences in cytotoxic score (left) and exhausted score (right) of T cells between two pyroptosis groups. (G) Differences in number of inferred interactions (left) and interaction strength (right) of all cells between two pyroptosis groups. (H) Circos plots displaying putative ligand-receptor interactions between T cells and other cell clusters from high-PRGScore (left) and low-PRGScore (right) group. The brand links pairs of interacting cell types, and corresponding number of events were labeled in the graph. (I) Circos plots displaying putative ligand-receptor interactions between Tumor cells and other cell clusters from high-PRGScore (left) and low-PRGScore (right) group. The brand links pairs of interacting cell types, and corresponding number of events were labeled in the graph. (J) Circos plots showing the CXCL signaling pathways between high-PRGScore (left) and low-PRGScore (right) group. (K) Circos plots showing the MHC-II signaling pathways between high-PRGScore (left) and low-PRGScore (right) group.

