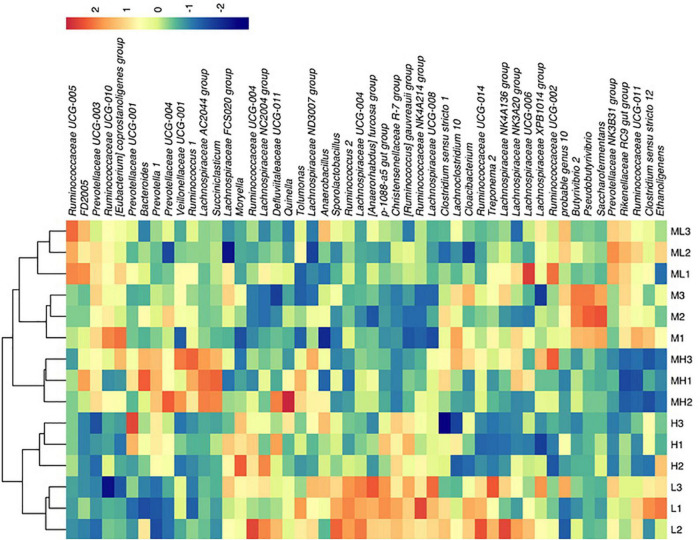
FIGURE 5.
Heat map of species abundance at the genus level (top 50 bacteria). H group: 33.0% peNDF1.18 treatment. MH group: 29.9% peNDF1.18 treatment. M group: 28.1% peNDF1.18 treatment. ML group: 26.5% peNDF1.18 treatment. L group: 24.8% peNDF1.18 treatment. The abscissa is sorted according to the order of the samples, and the ordinate is arranged according to the total average abundance from top to bottom. The relative abundance of the genus is not converted, and the legend shows the percentage. The redder color represents higher abundance, and the bluer color represents lower abundance.

