Figure 1.

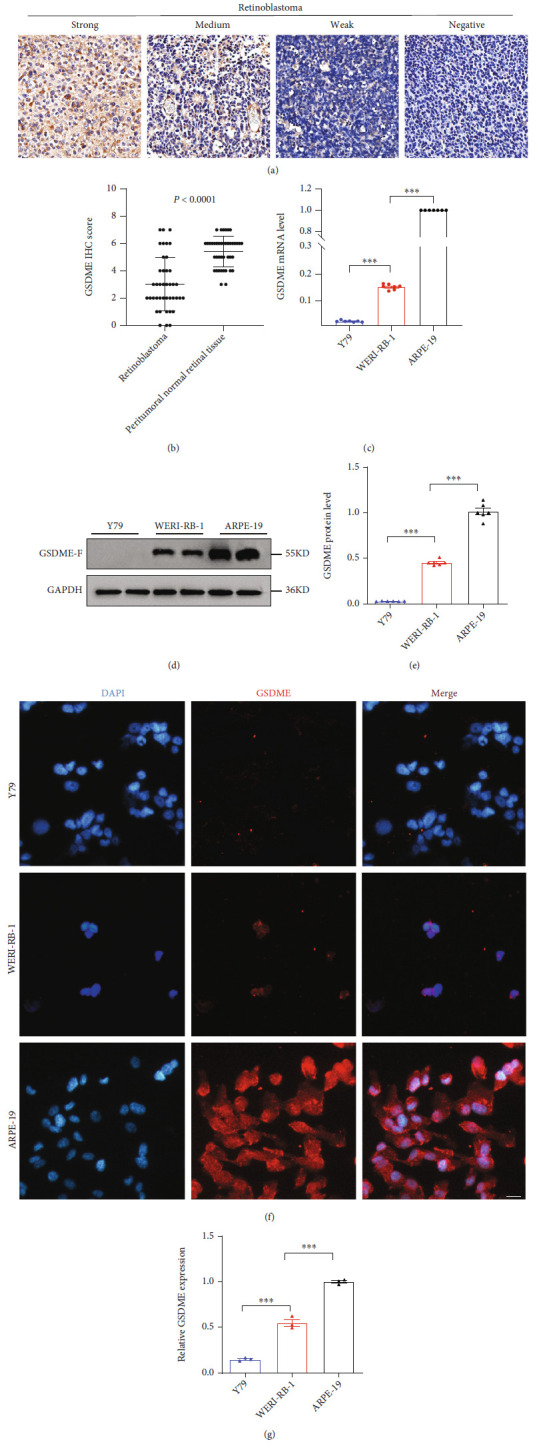
GSDME expression differences in human retinoblastoma. (a) Representative images of weak, medium, strong, and negative GSDME IHC staining. (b) Scatterplots of the average staining scores of GSDME expression in RB and peritumoral normal retinal tissues. (c) RT-PCR was applied to detect GSDME mRNA levels in the Y79, WERI-RB-1, and ARPE-19 cell lines. (d and e) The expression of GSDME protein was detected in the three cell lines using WB, and a quantitative map was drawn. (f and g) The expression of GSDME protein was detected in the three cell lines using immunofluorescence, and a quantitative map was drawn. Each experiment was repeated at least three times. Scale bar, 100 μm.
