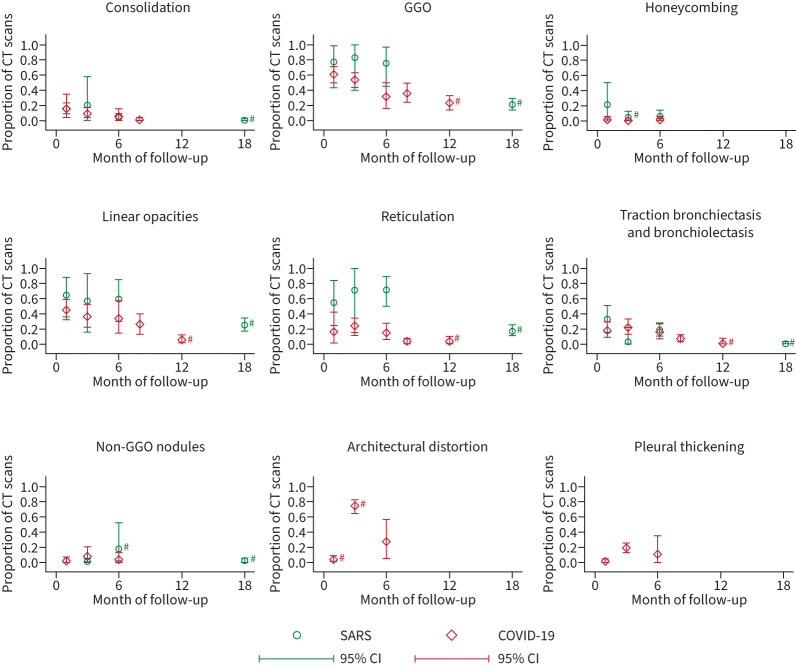
FIGURE 4.
Meta-proportion results of computed tomography (CT) features during the first 18 months of follow-up after SARS and COVID-19 infection. SARS: severe acute respiratory syndrome; COVID-19: severe acute respiratory syndrome coronavirus 2; 95% CI: 95% confidence interval; GGO: ground-glass opacity. #: one study only reporting data for this time period.

