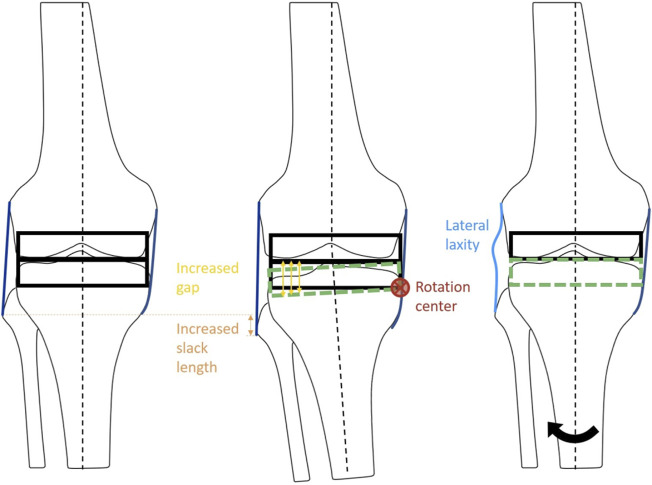
FIGURE 2.
Schematic diagram of the ligament adjustment process. The balanced neutral alignment model (left). Ligament adjustment performed at 2° varus (center). Model G: Neutral alignment model with laxity at lateral ligaments with balanced medial ligaments (right). Black arrow indicates the rotation of tibia from varus to neutral alignment.

