
FIGURE 4.
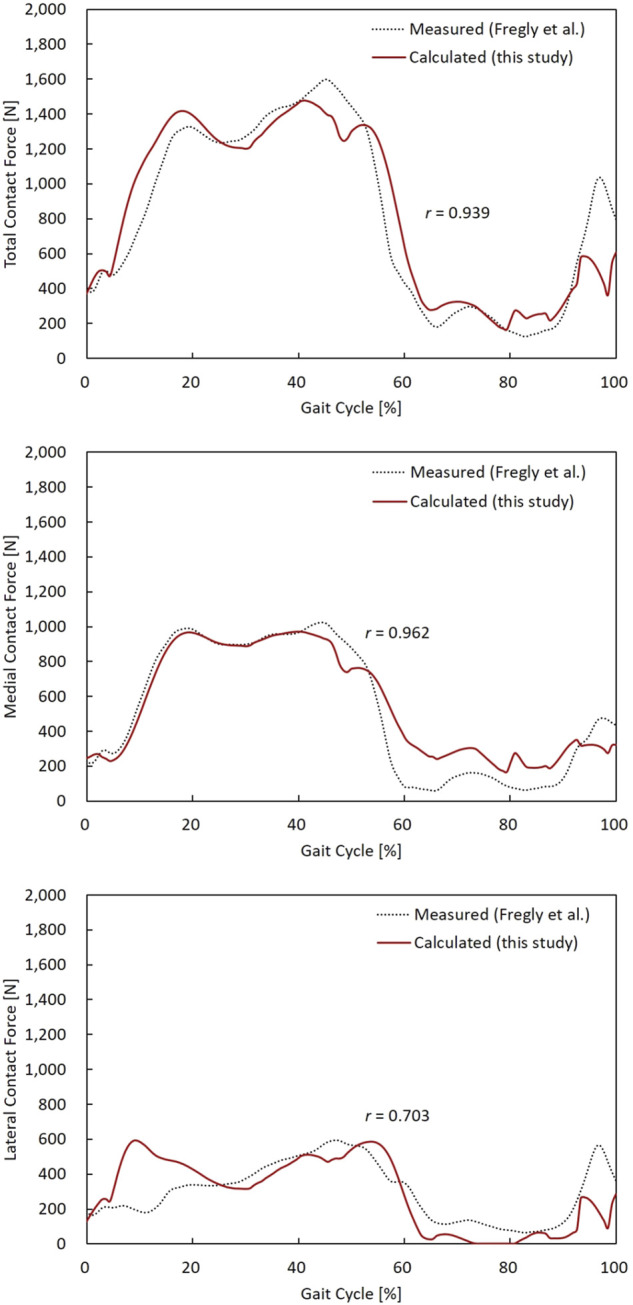
TCF, MCF, and LCF calculated from the model, and the measured data were compared during a gait cycle. Pearson’s correlation coefficient (r) for TCF, MCF, and LCF were 0.939, 0.962, and 0.703, respectively.
Official websites use .gov
A
.gov website belongs to an official
government organization in the United States.
Secure .gov websites use HTTPS
A lock (
) or https:// means you've safely
connected to the .gov website. Share sensitive
information only on official, secure websites.
TCF, MCF, and LCF calculated from the model, and the measured data were compared during a gait cycle. Pearson’s correlation coefficient (r) for TCF, MCF, and LCF were 0.939, 0.962, and 0.703, respectively.