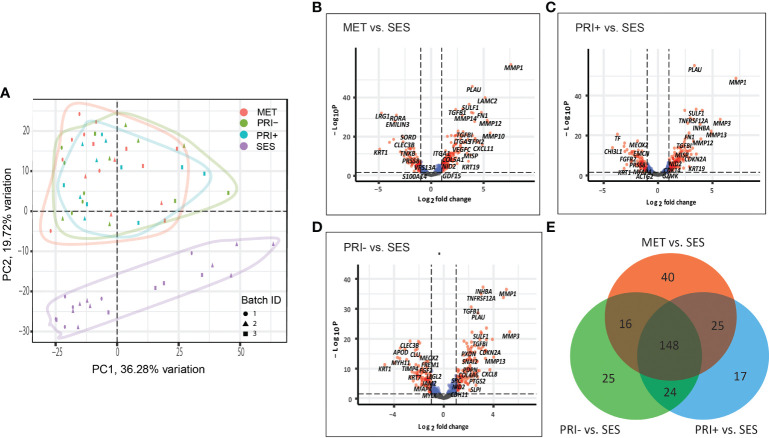
Figure 1.
Cancer progression gene expression patterns of sun-exposed skin (SES) and non-metastatic (PRI-) and metastatic (PRI+ and MET) cSCC. (A) Principle component plot of tumor cohorts and SES normalized gene expression data. The first and second principal components are plotted on the x- and y-axis, respectively. Batch ID symbols indicate different NanoString runs and show lack of batch effect. (B–D) Volcano plots illustrating gene expression differences (x-axis) and significance (y-axis) (dotted horizontal lines) of (B) MET vs. SES, (C) PRI+ vs. SES, and (D) PRI- vs. SES. Each dot represents a gene. (E) Venn diagram depicting DEGs with log2 fold changes of ≥1 or ≤-1 between MET vs. SES, PRI+ vs. SES, and PRI- vs. SES and adjusted p-value ≤ 0.05. The number of DEGs for each pairwise comparison is indicated in the circles of the Venn diagram. The overlap between the circles shows DEGs that occur in more than one comparison.

