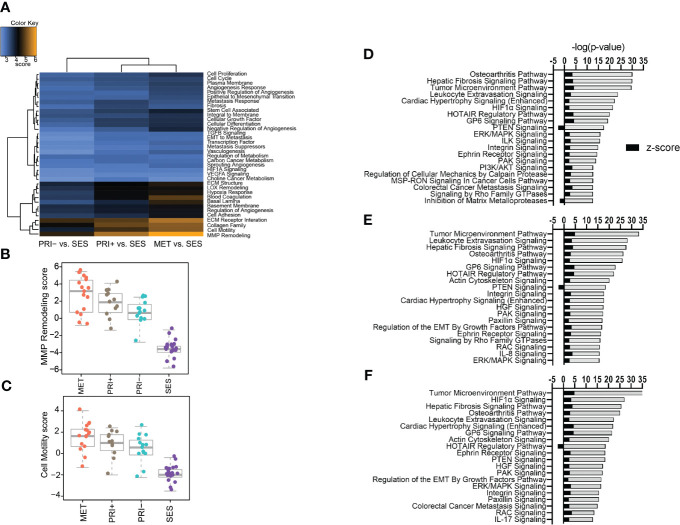
Figure 2.
Pathway analyses of tumors vs. SES. (A) Heatmap of global significance scores of cancer progression gene annotations generated using nSolver Advanced Analysis software 2.0 (orange denotes gene sets whose genes exhibit extensive differential expression with the covariate (SES), blue denotes less differential expression). (B, C) Boxplots showing pathway scores (y-axis; fit using the first principal component of each gene set’s data) for two of the top differentially expressed cancer pathways specified in the heatmap. (D–F) Top 20 activated and inhibited canonical pathways (refer to Supplementary Data File 3 ) for (D) MET vs. SES, (E) PRI+ vs. SES, and (F) PRI- vs. SES showing significance level (-log (p-value)) along the x-axis and absolute activation z-score (<-2, >2) along the y-axis.

