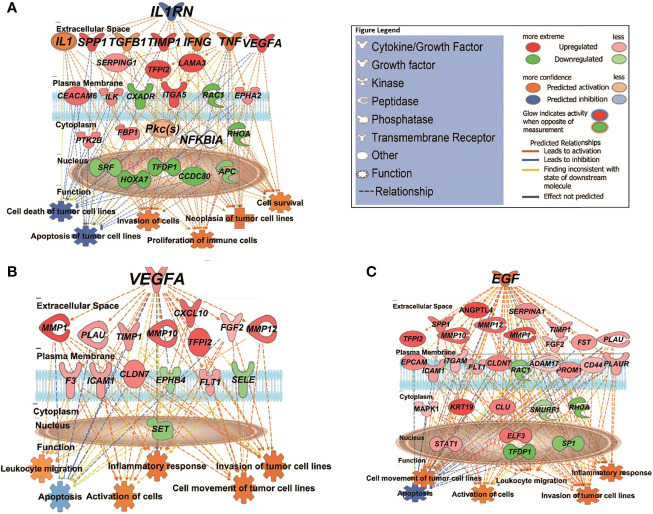
Figure 4.
IPA causal network analysis depicting the interactions between upstream regulators, downstream genes, and physiological functions in cSCC. (A) MET vs. PRI+ comparison showing effect of predicted master regulator IL1RN (depth: 2). (B, C) MET vs. PRI- comparison showing predicted master regulators VEGFA (depth: 1) and EGF (depth: 1). Master regulators were predicted based on the causal paths known to influence the expression of their target genes leading to the physiological functions shown. Regulators with depth of 2 influence the expression of target genes via other regulators. Figure legend indicates whether genes were upregulated or downregulated in MET relative to PRI tumors; the predicted activation state of the upstream regulators, and the predicted relationships between these and downstream genes and functions.

