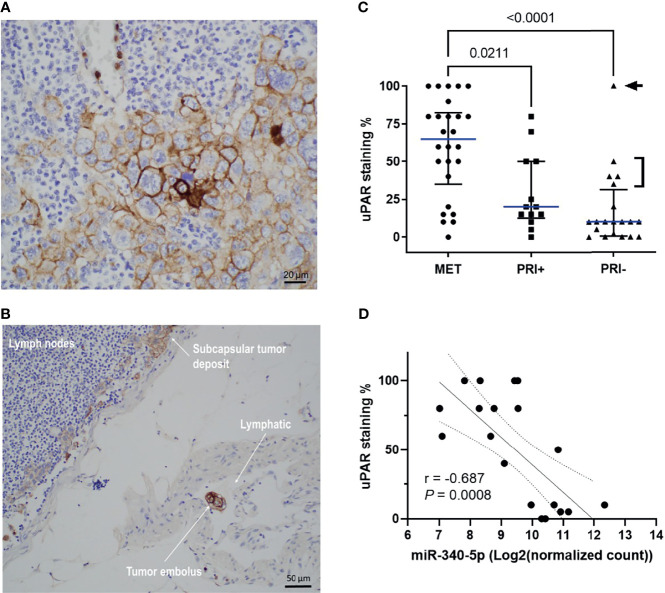
Figure 5.
uPAR protein expression is increased on metastatic tumors and correlates with miRNA-340-5p expression. Representative photomicrographs showing uPAR staining in (A) a metastatic deposit in the lymph node of Patient 2 and (B) a positively stained embolus as well as staining in the subcapsular tumor deposit from the lymphatic of patient 2. (C) Scatter plot of uPAR IHC scores of all patient specimens stained (n = 58 total) showing cohort median values (blue line) with interquartile ranges (refer to Table S3 for individual patient values). p-values shown were derived using a Kruskal–Wallis test for multiple comparisons with uncorrected Dunn’s posttest. Arrowhead denotes patient 37 who had a 160 mm diameter × 70 mm thick PRI-. Bracket denotes PRI- tumors with >50-mm diameter and PNI. (D) Scatter plot showing relationship between uPAR staining scores and hsa-miR-340-5p normalized gene count (n = 20 pairs; refer to Table S6 ) and show Rho (Spearman’s) correlation, p-value, and interquartile range for the correlation.

