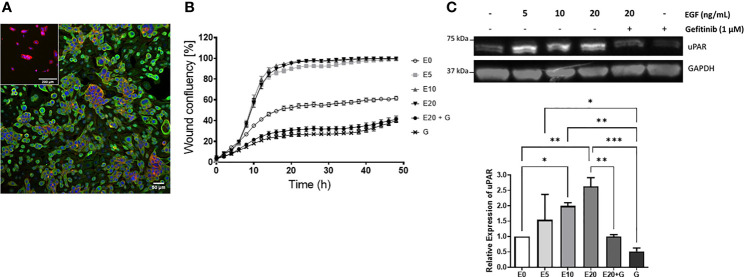
Figure 6.
EGF upregulation of cSCC cell line motility and uPAR expression. (A) Immunocytochemical image of UW-CSCC2 cells stained with anti-EGFR antibody (green) or anti-mouse IgG negative control (inset) and counterstained with RedDot (blue) and ActinRed 555 (red). (B) Representative in vitro scratch wound healing assay showing effect of EGF E ± EGFR inhibitor gefitinib G on simple migration of UW-CSCC2 cells. Values shown are mean ± SEM, n = 5; all treatment groups were significantly different from untreated controls p-value < 0.05, all gefitinib treatment groups significantly different to EGF only treatment groups p-value < 0.001; ordinary one-way ANOVA with Dunnett’s post-test. (C) Representative Western blot (right panel) demonstrating UW-CSCC2 uPAR levels in response to 24-h pretreatment with EGF ± gefitinib, at concentrations shown. Panel below: densitometry analysis showing the ratios of uPAR/GAPDH (used as a total protein loading control) for each treatment relative to no EGF control. Significance values are shown with *p-value < 0.05; **p-value < 0.01; ***p-value < 0.001.

