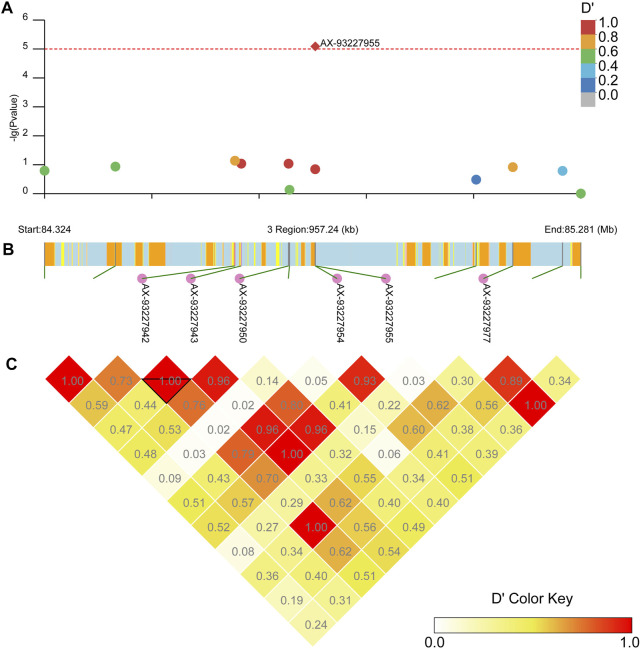
FIGURE 9.
Linkage block analysis of loci AX-93227955 on Ae. aegypti chromosome 3 using the package LDBlockShow. (A) Manhattan plot with significance line (red). SNPs are colored following the key at top right. (B) Genes in the region where the CDS is in yellow, introns are in light blue, UTR is in pink, and intergenic regions are in orange. Loci linked to AX-93227955 are annotated. (C) Heatmap with D’ estimates.

