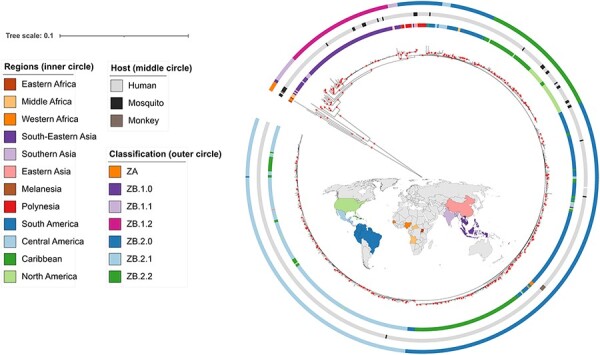
Figure 1.

ML tree of the full dataset (759 sequences). Colour annotations are given in the circles around the terminal nodes. From inner to outer circle: geographical regions (same colours as in the map); host; proposed classification. Red circles indicate support values SH-aLRT ≥80 per cent and UFBoot ≥95 per cent. A version of this tree including the node labels is provided in Supplementary Fig. S3.
