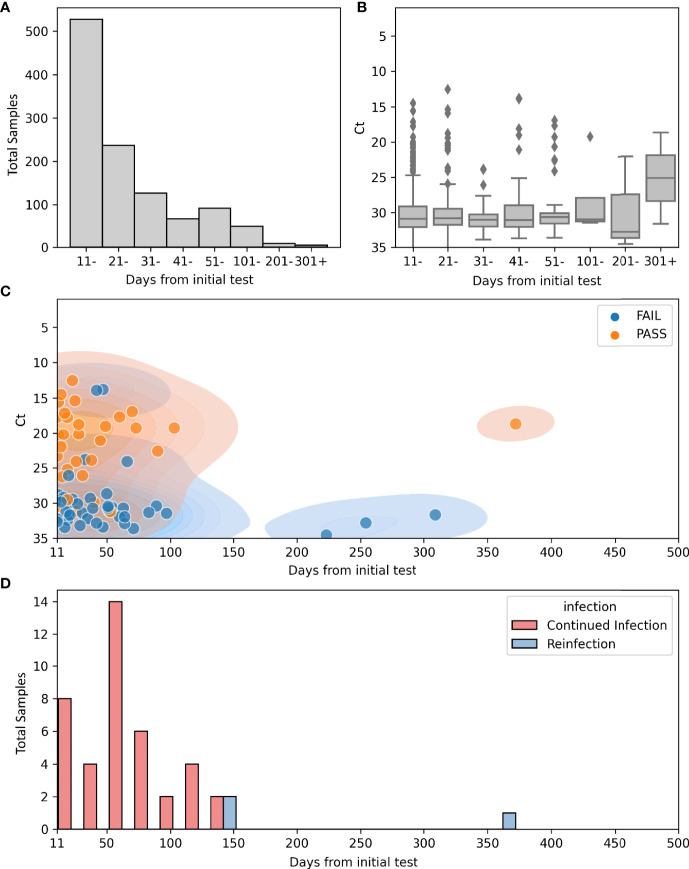
Figure 2.
Repeat positives from March 11th 2020 to September 23rd 2021. (A) Count plot of total numbers of repeat positives >10 days from the initial positive and the relation to the time after the first positive (N = 1115): 528 (11-20), 237 (21-30), 127 (31-40), 67 (41-50), 92 (51-100), 49 (101- 200), 9 (201-300), 6 (301-400). (B) Boxplot for Ct values in repeat positive samples and the relation to the time after the first positive (N = 589): 306 (11-20), 140 (21 -30), 60 (31- 40), 34 (41-50), 40 (51-100), 4 (101-200), 3 (201- 300), 2 (301-400). (C) Scatterplot of sequenced repeat samples >10 days from initial positive overlying kernel density estimate (KDE plot) of the same information. Hue indicates quality of sequences. N=222 Total, 155 failed quality metrics, 67 High quality genomes. (D) Histogram of days from initial positive sample in continued infection (Red, N = 40) or reinfection (Blue, N = 3).

