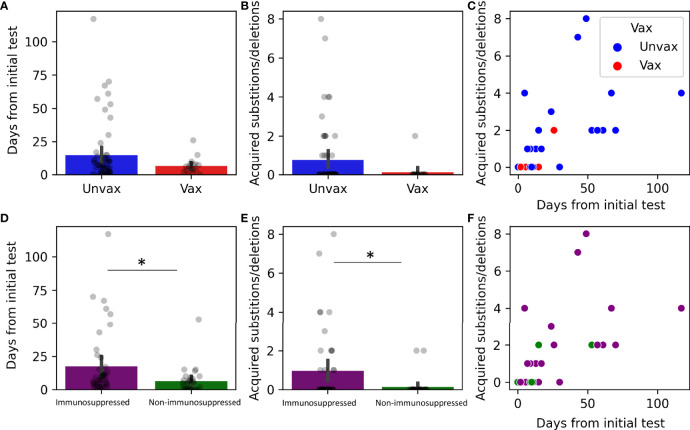
Figure 6.
Genomic changes in prolonged viral shedding by vaccination and immune status. Substitutions and deletions in 75 patients by status: vaccinated (N =17, A–C) and immunosuppressed (N=44, D–F). (A, D) Barplots with overlayed strip plots of mean time of prolonged shedding of complete genomes in each group, (B, E) Barplots with overlayed strip plots of amino acid change frequency in each group, (C, F) Scatterplots of the correlation of amino acid change and the days after the first positive in each group. *p < 0.05. Unvax, unvaccinated; Vax, vaccinated.

