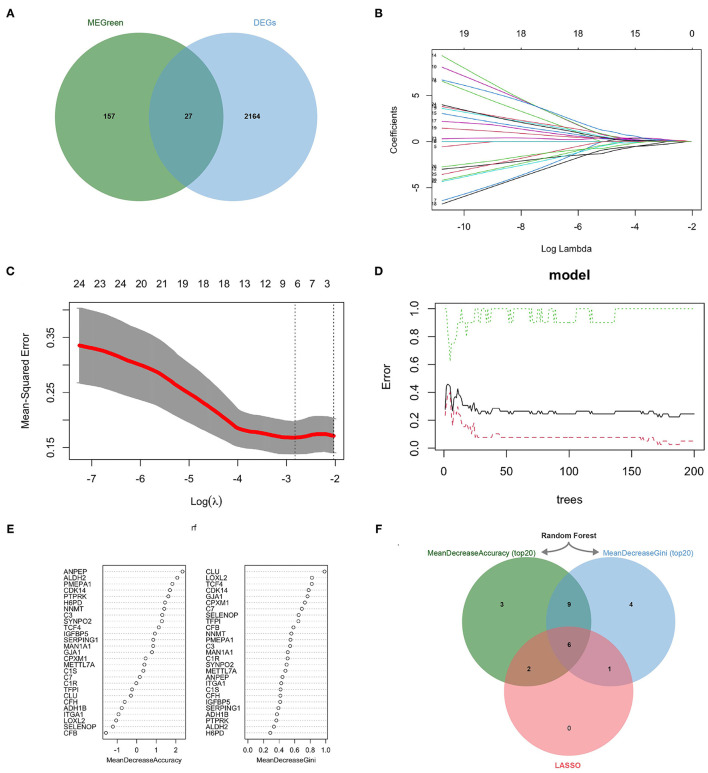
Figure 3.
KCDEGs were identified by the LASSO and random forest algorithm. (A) Venn diagram showing the intersection between the green module genes and the differential anti-PD-1 treatment response genes. (B,C) LASSO was used to determine the optimal gene variables, and the model achieved the best performance when log(λ) was set to −2.788. (D,E) Random forest was used to screen gene variables, 150 trees were selected to build a robust model, and genes were sorted according to mean decrease accuracy and mean decrease Gini. (F) Venn diagram of six KCDEGs identified by two machine learning algorithms. KCDEGs, key CAFs-related differentially expressed genes; LASSO, least absolute shrinkage and selection operator.

