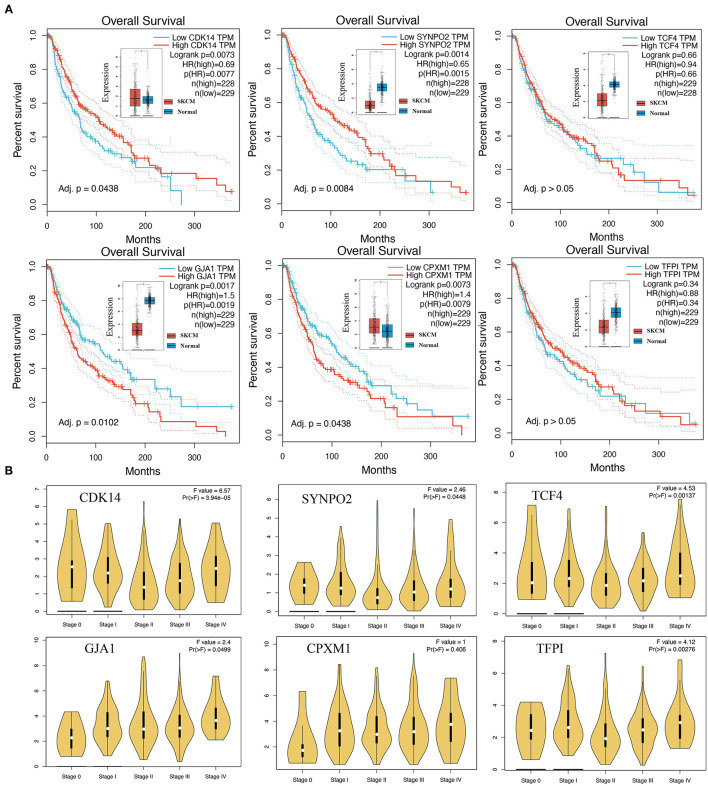
Figure 5.
The association of KCDEGs with survival and staging was determined by GEPIA. (A) Kaplan-Meier curve showing the survival of patients with high and low expression of KCDEGs based on TCGA-SKCM. The built-in box plot shows the expression level of KCDEGs in SKCM and normal samples. (B) Violin diagram showing the expression level of KCDEGs in samples with different TCGA-SKCM stages. SKCM, skin cutaneous melanoma.

