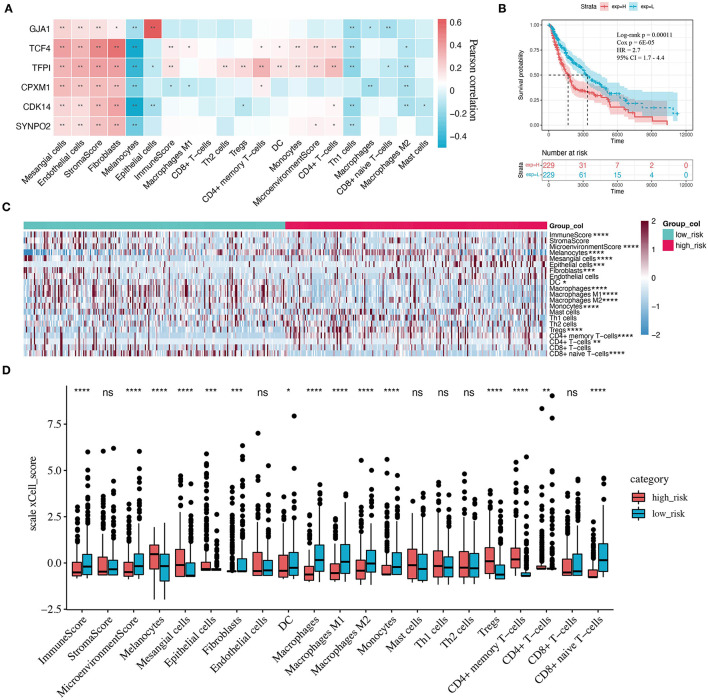
Figure 6.
Correlation between KCDEGs and tumor microenvironment (TME) components. (A) Heatmap of the Pearson correlation between KCDEGs and 21 TME features. *, P < 0.05; **, P < 0.01. (B) Kaplan-Meier curve showing the survival difference of patients between high and low risk score groups. (C,D) Heatmap and box plot depicting differences of TME features in two risk score groups. Wilcoxon test, *, P < 0.05; **, P < 0.01; ***, P < 0.001; ****, P < 0.0001.

