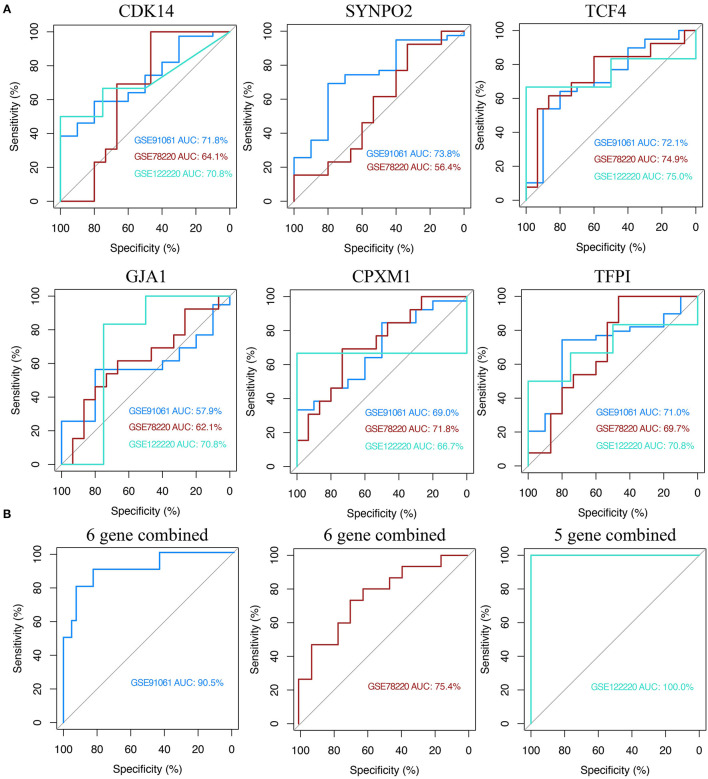
Figure 7.
Receiver operating characteristic (ROC) curve analysis of KCDEGs of discovery set and two validation sets. (A) Independent diagnostic performance of KCDEGs in discovery set (GSE91061) and two validation sets (GSE78220 and GSE122220). No corresponding probe of SYNPO2 was found in GSE122220. (B) Combined diagnostic performance of KCDEGs in the discovery set and two validation sets. AUC, area under the curve.

