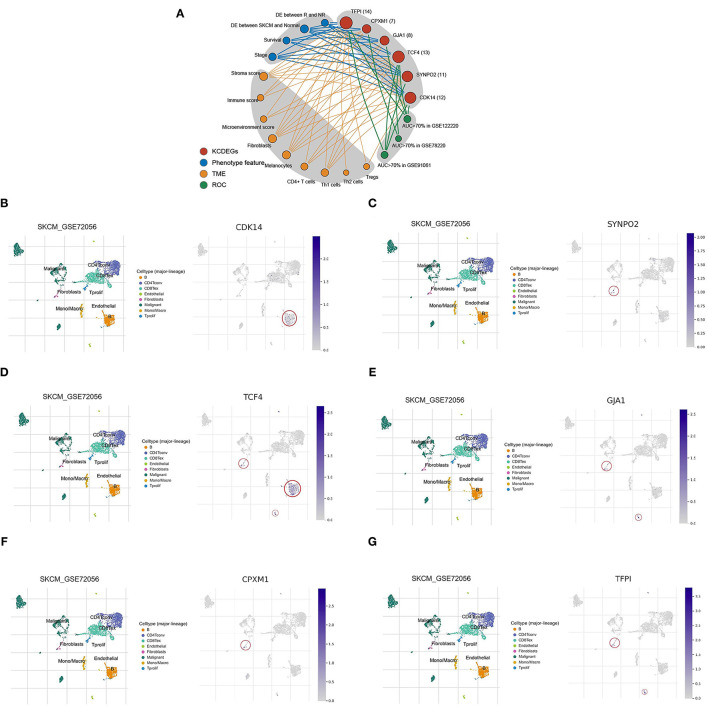
Figure 8.
Characteristic network and single-cell analysis of KCDEGs. (A) Multidimensional feature network of KCDEGs. Different feature nodes are marked by different colors, and a larger circle means more nodes are connected. (B–G) Heatmap showing KCDEGs expression of different cell types in six single-cell RNA-seq datasets analyzed by Tumor Immune Single Cell Hub, and the built-in single-cell UMAP map depicting the expression distribution of KCDEGs in SKCM single-cell dataset GSE72056. DE, different expression.

