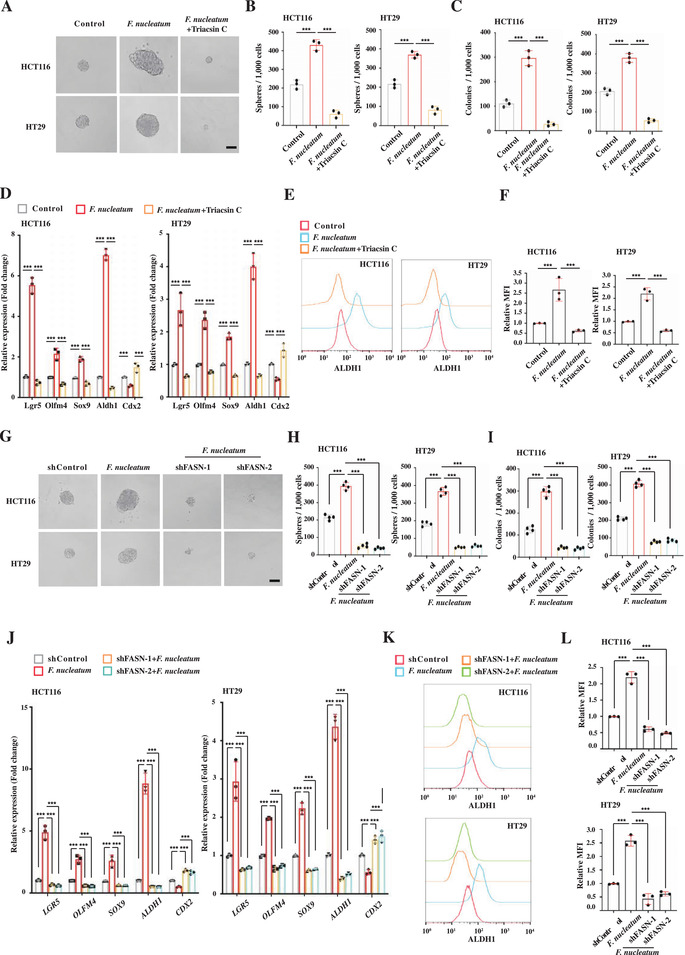
Figure 4.

F. nucleatum promotes CRC cells to acquire stem‐like features by increasing lipid accumulation. A,B) Representative images (A) and quantification (B) of sphere formation of the control, F. nucleatum‐infected, and F. nucleatum‐infected with Triacsin C treatment (3 µm) HCT116 and HT29 cells. Error bars denote the s.d. (n = 3 per group). p‐Value was calculated using one‐way ANOVA with post‐hoc test. ***, p < 0.001. Scale bar, 100 µm. C) Clonogenicity assay of the control, F. nucleatum‐infected, and F. nucleatum‐infected with Triacsin C treatment (3 µm) HCT116 and HT29 cells. Error bars denote the s.d. (n = 3 per group). p‐Value was calculated using one‐way ANOVA with post‐hoc test. ***, p < 0.001. D) RT‐qPCR showing the relative expression levels of CCSC marker Lgr5, Olfm4, Sox9, and Aldh1 and differentiated marker Cdx2 in the control, F. nucleatum‐infected, and F. nucleatum‐infected with Triacsin C treatment (3 µm) HCT116 and HT29 cells. Error bars denote the s.d. (n = 3 per group). p‐Value was calculated using one‐way ANOVA with post‐hoc test. ***, p < 0.001. E,F) Representative histogram (E) and quantification (F) of flow cytometry showing ALDH1 expression in the control, F. nucleatum‐infected, and F. nucleatum‐infected with Triacsin C treatment (3 µm) HCT116 and HT29 cells. Error bars denote the s.d. (n = 3 per group). p‐Value was calculated using one‐way ANOVA with post‐hoc test. ***, p < 0.001. G,H) Representative images (G) and quantification (H) of sphere formation of the control, F. nucleatum‐infected, and F. nucleatum‐infected with FASN knockdown (shFASN‐1 and shFASN‐2) HCT116 and HT29 cells. Error bars denote the s.d. (n = 4 per group). p‐Value was calculated using one‐way ANOVA with post‐hoc test. ***, p < 0.001. Scale bar, 100 µm. I) Clonogenicity assay of the control, F. nucleatum‐infected, and F. nucleatum‐infected with FASN knockdown (shFASN‐1 and shFASN‐2) HCT116 and HT29 cells. Error bars denote the s.d. (n = 4 per group). p‐Value was determined using one‐way ANOVA with post‐hoc test. ***, p < 0.001. J) RT‐qPCR showing the relative expression levels of CCSC marker Lgr5, Olfm4, Sox9, and Aldh1 and differentiated marker Cdx2 in the control, F. nucleatum‐infected, and F. nucleatum‐infected with FASN knockdown (shFASN‐1 and shFASN‐2) HCT116 and HT29 cells. Error bars denote the s.d. (n = 3 per group). p‐Value was calculated using one‐way ANOVA with post‐hoc test. ***, p < 0.001. K,L) Representative histogram (K) and quantification (L) of flow cytometry showing ALDH1 expression in the control, F. nucleatum‐infected, and F. nucleatum‐infected with FASN knockdown (shFASN‐1 and shFASN‐2) HCT116 and HT29 cells. The red and blue histograms represent uninfected controls and infected cells, respectively. Error bars denote the s.d. (n = 3 per group). p‐Value was calculated using one‐way ANOVA with post‐hoc test. ***, p < 0.001.
