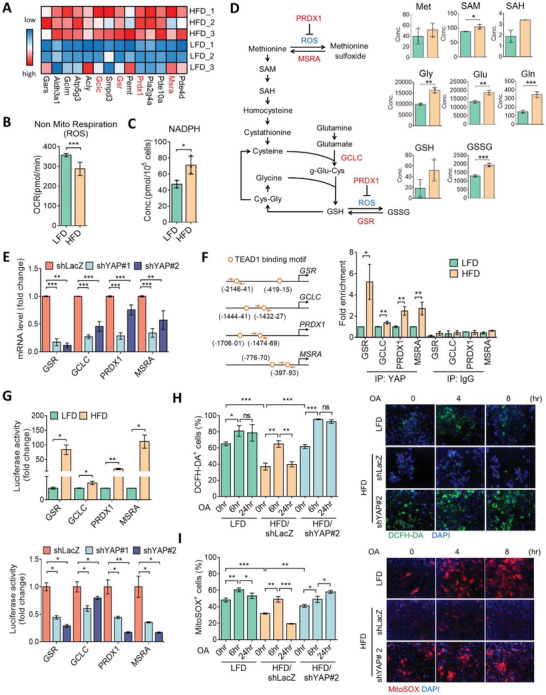
Figure 4.

YAP governs mitochondrial oxidative stress in obesity‐associated tumor cells. A) Heatmap of differentially expressed metabolic genes associated with YAP in HFD and LFD cells. B) The nonmitochondrial respiratory ROS production in LFD or HFD cells with a Seahorse Analyzer. C) Absolute quantitative analysis of NADPH level in HFD and LFD cells. D) Changes in the concentrations of metabolites in glutathione metabolism in HFD and LFD cells. E) qPCR analysis of MSRA, GCLC, GSR, and PRDX1 expressions in HFD/shLacZ and HFD/shYAP cells. F) Illustration of putative TEAD1‐binding sites in the MSRA, GCLC, GSR, and PRDX1 promoter regions (left panel). Arrows indicate primers for the chromatin immunoprecipitation analysis. Enrichment of YAP in the MSRA, GCLC, GSR, and PRDX1 promoters by chromatin immunoprecipitation assay (right panel). G) Luciferase reporter assay of the transcriptional activities of MSRA, GCLC, GSR, and PRDX1 in LFD and HFD tumor cells (upper panel) and in HFD/shLacZ and HFD/shYAP cells (lower panel). H) Flow cytometric analysis of 2'‐7'dichlorofluorescin diacetate (DCFH‐DA+) cell populations in LFD, HFD/shLacZ, and HFD/shYAP cells exposed to oleic acid (OA: 100 × 10−6 m) for 0, 6, and 24 h, and representative images by fluorescent microscope observations are shown in the right panel. I) Flow cytometric analysis (left panel) and fluorescent images (right panel) of MitoSOX+ cells in LFD, HFD/shLacZ, and HFD/shYAP cells exposed to OA as described above. Data are expressed as the mean ± SD of at least three replicates. * p < 0.05, ** p < 0.01, *** p < 0.001, as determined by an unpaired two‐tailed Student's t‐test. ns, nonsignificant.
