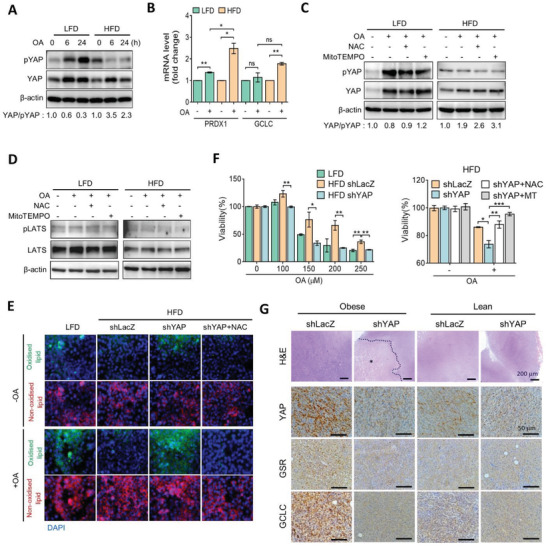
Figure 5.

YAP extenuates fatty acid‐mediated oxidative stress. A) Total and phosphorylated YAP protein levels of HFD and LFD cells treated with OA for 6 or 24 h, as assessed by Western blotting. B) qPCR analysis of GCLC and PRDX1 gene expressions in HFD and LFD cells treated with OA for 24 h. C) OA (100 × 10−6 m) was added to HFD or LFD cells pretreated with N‐acetyl‐cysteine (NAC) (2 × 10⁻³ m) or MitoTEMPO (5 × 10⁻⁶ m) for 24 h, and protein levels of total and phosphorylated YAP were assessed by Western blotting. D) OA (100 × 10−6 m) was added to HFD or LFD cells pretreated with NAC (2 × 10⁻³ m) or MitoTEMPO (5 × 10⁻⁶ m) for 6 h, and protein levels of total and phosphorylated LATS1 were assessed by Western blotting. E) LFD, HFD, or HFD shYAP cells were treated with OA for 24 h and stained with BODIPY 581/591 C11. F) LFD, HFD shLacZ, and shYAP cells were treated with different concentrations of OA for 24 h. OA (125 × 10−6 m) was added in HFD shLacZ and shYAP cells pretreated with NAC (2 × 10⁻³ m) or MitoTEMPO (5 × 10⁻⁶ m) for 24 h. Cell viability was measured by an 3‐(4,5‐Dimethylthiazol‐2‐yl)‐2,5‐diphenyltetrazolium bromide (MTT) assay. G) H&E and IHC images of YAP, GSR, and GCLC protein expressions in tumor tissues from obese and lean mice inoculated with Py8119/shLacZ and shYAP cells. Asterisk denotes necrotic area. Scale bar = 200 µm (H&E panels) and 50 µm (IHC panels). Data are presented as the mean ± SD. * p < 0.05, ** p < 0.01, *** p < 0.001, as determined by an unpaired two‐tailed Student's t‐test. ns, nonsignificant.
