Figure 7.

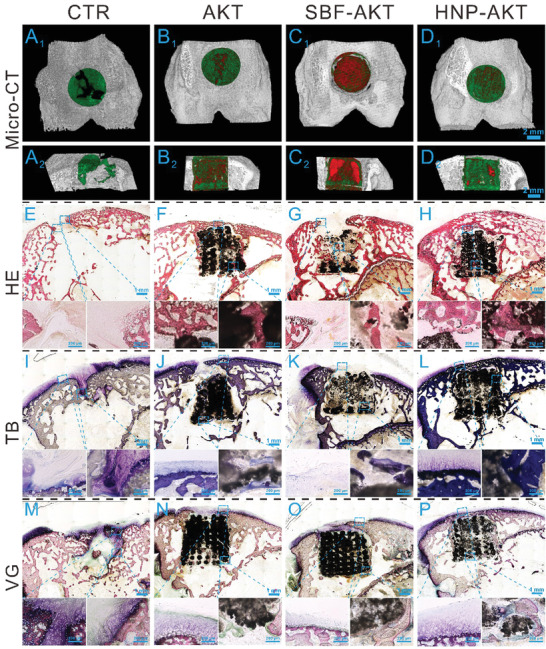
Osteochondral regeneration in vivo. A1–D2) showed the Micro‐CT images of the defects at 12 weeks post‐surgery. A1–D1) and A2–D2) displayed the transverse view and sagittal view of Micro‐CT images, respectively. The green color, red color, and grey‐white color in Micro‐CT images stand for new bone, scaffold, and native bone, respectively. Micro‐CT images indicated that HNP‐AKT group showed much more new bone tissue that than the other three experimental groups. E–H) HE staining, I–L) TB staining, M–P) VG staining. The scale bar in Micro‐CT images was 2 mm and the scale bars in the small images of HE, TB, and VG staining were 200 µm.
