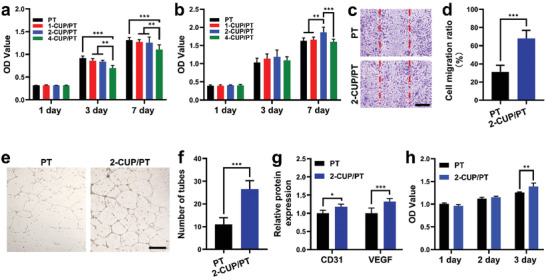
Figure 5.

Bioactivities of different composites on HEECs and HUVECs. a,b) Proliferation of HEECs (a) and HUVECs (b) after culture on different CUP/PT composites for 1, 3, and 7 days (n = 4). c) Cell migration analysis using scratch method after cocultured with PT and 2‐CUP/PT composite for 16 h. d) The corresponding cell migration ratio (n = 3). e) The tube formation assessment of HUVECs after cocultured with PT and 2‐CUP/PT composite for 12 h. f) The corresponding number of formed tubes (n = 3). g) ELISA analysis of CD31 and VEGF from HUVECs after cocultured with PT and 2‐CUP/PT composite for 48 h (n = 5). h) Proliferation of HEECs after culture with medium collected from HUVECs study (n = 5). Scale bar: 500 µm. All data are presented as mean ± SD. Statistical analysis was performed using one‐way ANOVA analysis, **p < 0.01, ***p < 0.001.
