
Figure 6.
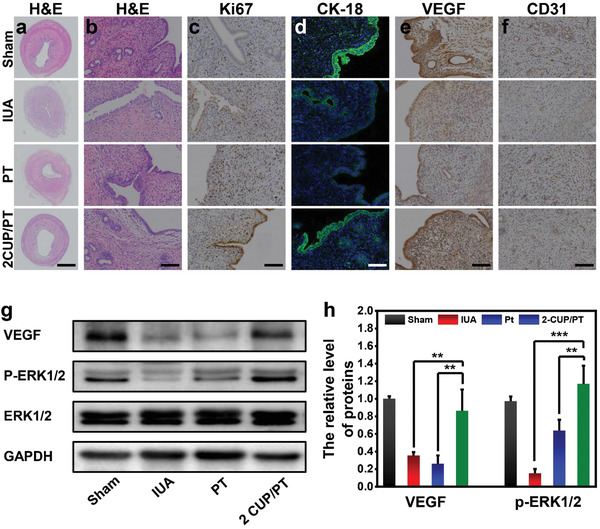
In vivo endometrium regeneration. a) Representative H&E staining images of uterine cavity in different treatments at day 14. b) The corresponding high magnification H&E images for the analysis of glands in each group. c,d) The immunohistochemistry staining targeting Ki67 (c) and immunofluorescence staining targeting CK‐18 (d) in different treatments at day 14. e,f) Representative images of immunohistochemistry staining targeting CD31 (e) and VEGF (f) in new‐formed tissues in different treatments at day 14. g) Western blotting analysis of the protein expressions of VEGF and P‐ERK1/2 in each group. h) The corresponding optical density analysis for western blotting assay (n = 5). Scale bar: 1 mm in (a), 50 µm in (b,c,e,f), and 10 µm in (d). All data are presented as mean ± SD. Statistical analysis was performed using one‐way ANOVA analysis, **p < 0.01, ***p < 0.001.