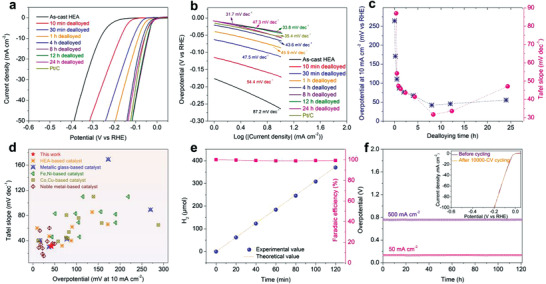
Figure 3.

a) Polarization curves of the dealloyed FeCoNiCu HEA electrodes with different etching times in comparison with the Pt/C catalyst electrode in a 1.0 m KOH aqueous electrolyte. b) Tafel plots of the corresponding electrodes from the polarization curves. c) Variations of dealloying duration‐dependent HER performance (Left: overpotential at 10 mA cm−2; right: Tafel slope). d) Comparison of the HER performance of the optimal dealloyed HEA sample with various recently reported HER electrocatalysts in alkaline solutions. e) HER Faradaic efficiency of the 8 h dealloyed HEA electrode in 1.0 m KOH electrolyte at a current density of 10 mA cm−2. f) Long‐term stability measurement of the dealloyed HEA electrode at the current densities of 50 and 500 mA cm−2, respectively, for more than 120 h. The inset shows the HER polarization curves of the dealloyed HEA electrode before and after 10 000‐CV cycling.
