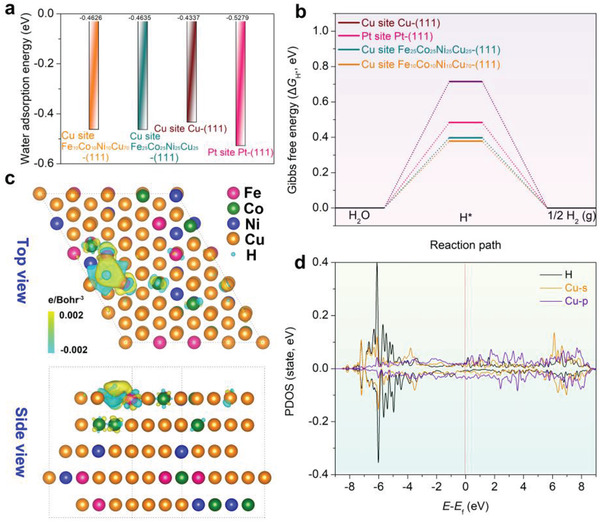
Figure 4.

a) Comparison of the adsorption energies of H2O molecule on the optimal sites of the Fe10Co10Ni10Cu70‐(111), Fe25Co25Ni25Cu25‐(111), pure Cu‐(111), and Pt‐(111) surfaces. b) Gibbs free energies for hydrogen adsorption at different optimal active sites of the catalyst surfaces. c) Computed differential charge densities for hydrogen adsorption on the optimal Cu site of the Fe10Co10Ni10Cu70‐(111) surface. Yellow and blue bubbles represent the positive and negative charges with an iso‐value of 0.002 e Å−3, respectively. d) PDOS of the Fe10Co10Ni10Cu70‐(111) surface after the H* adsorption on the optimal Cu site. The red dotted lines at the energy of zero indicate the Fermi level.
