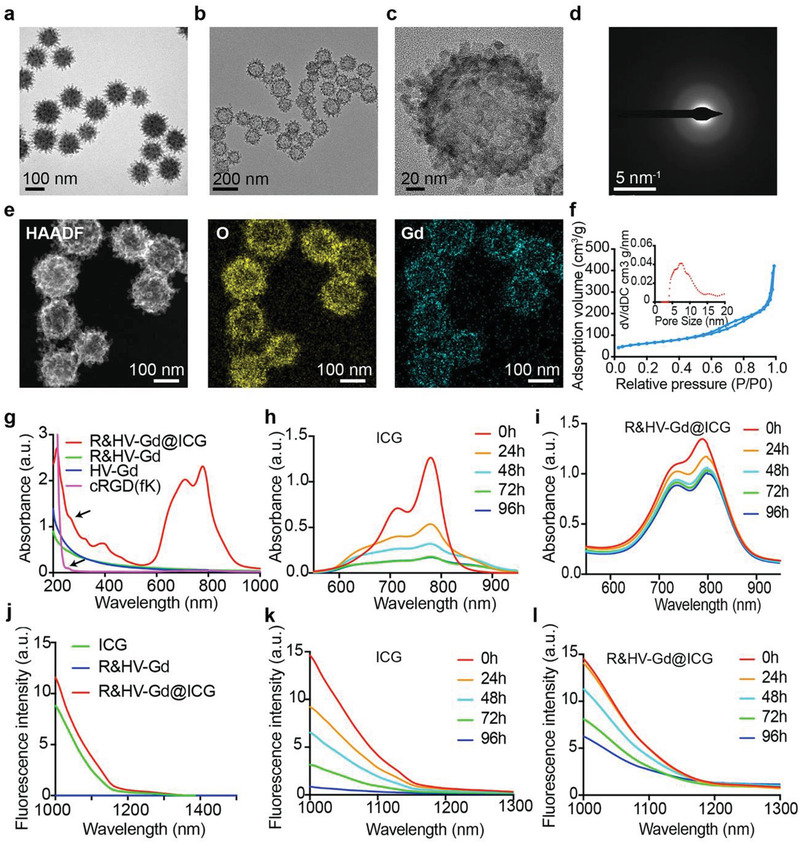
Figure 2.

Nanoprobe synthesis and characterization. TEM images of a) Si‐V and b) HV‐Gd. HV‐Gd c) high‐resolution TEM and d) diffraction images. e) HAADF‐STEM image and corresponding HV‐Gd elemental mapping. f) HV‐Gd pore‐size distribution curve and nitrogen adsorption–desorption isotherms. g) UV–NIR absorption spectra for cRGD(fK), HV‐Gd, R&HV‐Gd, and R&HV‐Gd@ICG. Changes in absorption and fluorescence spectra for h,k) free ICG and i,l) R&HV‐Gd@ICG in aqueous solution for 96 h, respectively. j) Fluorescence emission spectra generated in NIR‐II window for ICG, R&HV‐Gd, and R&HV‐Gd@ICG.
