
Figure 6.
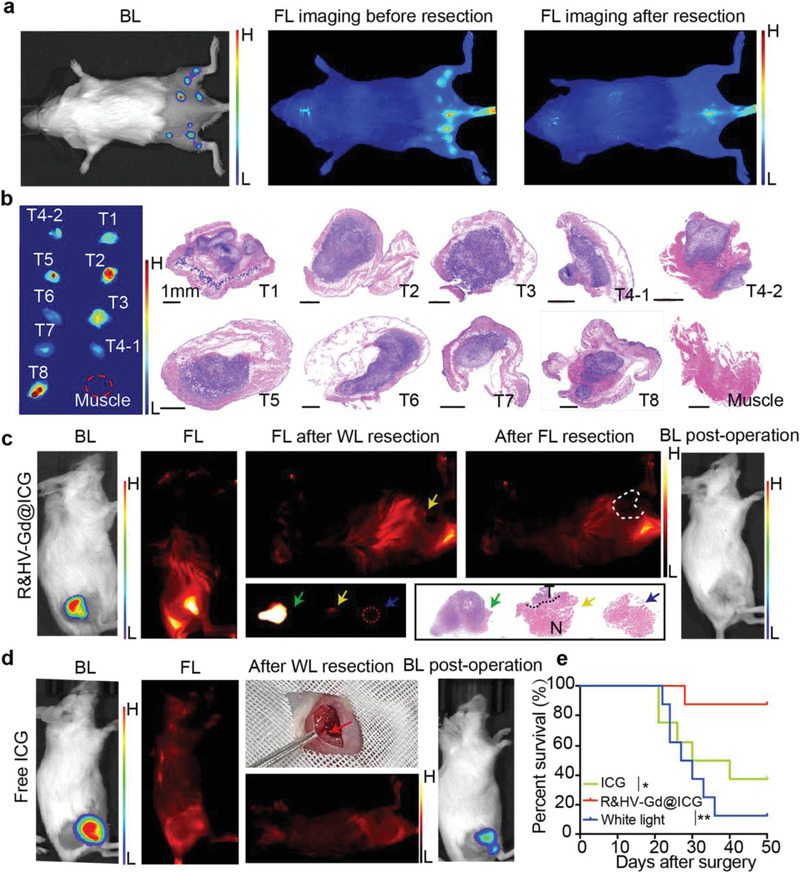
NIR‐II fluorescent image‐guided surgically resected 4T1‐Luc tumors. a) Preoperative bioluminescent, intraoperative, and postoperative fluorescence images taken during tumor resection surgery on representative multiple microtumor mouse model injected with R&HV‐Gd@ICG. b) In vitro fluorescence and corresponding H&E‐stained histological images of tumor tissue. Preoperative, intraoperative, and postoperative images taken during white‐light‐only and NIR‐II fluorescence‐guided tumor resection surgeries on representative mouse models injected with c) R&HV‐Gd@ICG and d) ICG. H&E‐stained histological images of surgical margins showing primarily tumor (green asterisk), residual tumor tissue (yellow asterisk), and negative surgical margin after secondary fluorescence‐guided surgery (black asterisk). e) Kaplan–Meier analysis showing significant difference in survival of R&HV‐Gd@ICG, ICG, and white‐light‐only‐guided surgery groups (n = 8, statistical significance was assessed using Log‐rank test, *p < 0.05, **p < 0.01).