
Figure 7.
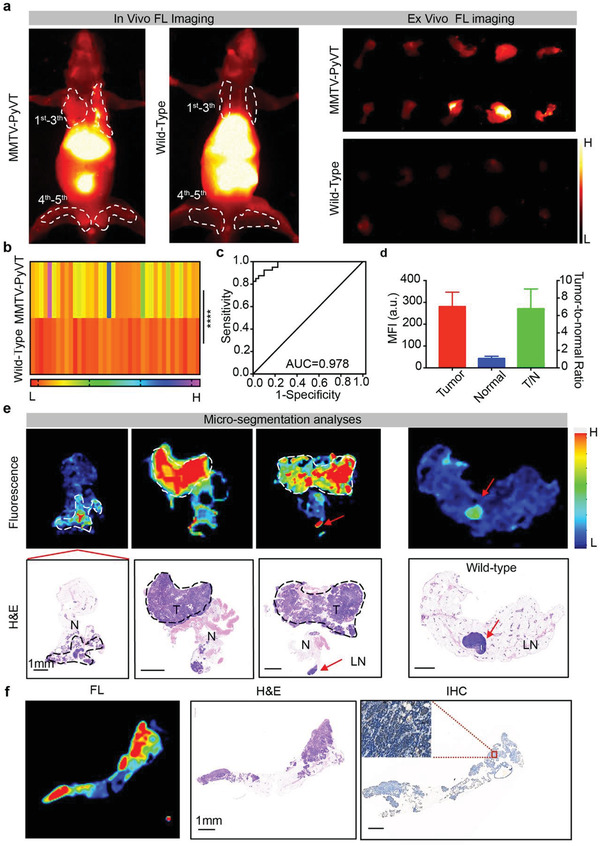
NIR‐II fluorescence imaging in spontaneous breast cancer mouse model. a) In vivo and ex vivo fluorescence images of mammary glands 48 h after MMTV‐PyVT transgenic and wild‐type mice were intravenously injected with R&HV‐Gd@ICG. b) Mean fluorescence intensities for 1st–5th layers of resected mammary gland tissue in MMTV‐PyVT transgenic and wild‐type mice (n = 40, statistical significance is determined by two‐tailed unpaired t‐test, ****p < 0.0001). c) Fluorescence imaging receiver operating characteristic (ROC) curve to differentiate between normal tissues and cancer tumors. d) Mean tumor TNR plotted as function of mean TNR in healthy breast tissue for transgenic mice, as measured using NIR‐II fluorescence intensity scanning for 10 µm thick tissue slices with Odyssey Imaging System. (Data were shown as means ± SD, n = 4.) e) Microscopic biodistribution of R&HV‐Gd@ICG in breast tissues. Upper row shows fluorescence images of 10 µm slices of mouse breast tissue. Lower row shows corresponding H&E staining. Dotted line indicates tumor area; red asterisk, lymph node. f) Representative example of breast tissue showing corresponding fluorescence image (left), H&E section (middle), and immunohistochemical stain of α v expression (right).